Strength Evaluation of Welded Aluminum T-joints, as a Function of Its Welding Process, Execution, Filler Material, and Weld Root Penetration
Article information

Abstract
Essential requirements for weld seams are the long-term transmission of static and time-varying forces. Requirements for the verification of laser welded fillet weld T-joints are proposed in this paper, since there is no established procedure in this field for laser welding. More precisely, the strength of laser MIG hybrid welded AlMg3Mn T-joints, made from 3.5 mm thick sheet metal are determined, depending on the penetration of their weld root gap. This allowed the unwelded root gap to be related to the decrease in strength, even though this is more apparent with dynamic than with static loading. In addition, the influence of filler material, single and mutual-sided MIG welds have been added to this comparison. Filler materials used are the related AlMg2.7Mn or the extraneous AlSi5.
1. Introduction
The enduring transmission of static and time-varying forces is a significant requirement for weld seams. These requirements can be checked by means of numerical strength verification and experimental tests. Geometrical and metallurgical properties that have a strength-reducing effect on the joint are of particular importance for welding. Abstractly, this can be expressed in the way that external forces induce stresses in the weld seam, which are to be compared with the permissible stresses in the calculated strength verification. These calculation procedures for static and fatigue strength verification can be carried out in different but comparable ways1-5).
Standards and guidelines of Deutsche Bahn AG and steel and crane construction are often used. In general, there are no generally binding calculation regulations for mechanical engineering and vehicle construction. For components that are subject to acceptance or subsequent operational monitoring, specific calculations according to existing regulations must be applied. For example, DS9526), FKM guideline7), IIW recommendations8), or Eurocode 3 are to be used for welded vehicles, machines, and devices4,9,10).
Basically, there are two approaches to determine the strength of a component (or a part of a component like a weld seam). On the one hand, the component can be tested experimentally. Unfortunately, this approach is not only quite cumbersome, time-consuming, and expensive, but it is also not possible in all cases to (unambiguously) test a given weld experimentally. For example, the loading could be so complex that it is difficult or impossible to apply the load in an experiment. On the other hand, prediction of the strength of welds is desirable to overcome the aforementioned issues. These predictions are made using a numerical approach.
Next, the numerical approach is explained in a nutshell. As an example, the FKM guideline provides a standardized procedure to predict the strength of a component. This guideline distinguishes between static strength verification and fatigue strength verification. In both cases, the FKM guideline provides a strategy to predict the stress-ability based on the material type (e. g., steel, aluminum), its characteristic strength (e.g., UTS), the design (e.g., notch factor, surface conditions) and the application where the component will be used (safety factors). This set of input parameters results in a predicted strength that may vary throughout the component. The predicted strength is then compared with the stresses occurring on the component. The stresses on a component are computed numerically, typically by using the Finite Element Method. As a result, the complete stress field of the component is known. Clearly, the stresses are depending on the component’s design and the loading conditions. By investigating the stress field one or more high stressed points can be determined, which oftentimes are located onto the surface of the weld seam or the weld root.
In this paper, experimental results regarding the strength of state of the art laser welded T-joints11-13) are presented and analyzed.
2. Experimental approach
The static and fatigue strength of single-sided and mutual-sided joints were measured on laser and MIG welded T-joints. To gain insight into the influence of the weld quality, specimen with different weld depths were produced.
The setup for welding is comprised of an articulated robot and a Fronius laser hybrid welding head, with an integrated Trans Puls Synergic welding system. A fiber laser of the type YLR-5000 was used. The laser was mounted in front of the MIG torch, piercing with a 5° angle and the MIG welding head follows 3 mm behind the -1 mm focal position, piercing with a 35° angle. The laser power of 4.1 kW was concentrated to a focal diameter of 220 ㎛ onto 3.5 mm thick sheets of AlMg3Mn. The welding speed was set to of 45 mm/s. Wires of either AlMg2.7Mn or AlSi5 were used as fillers.
MIG welds are carried out with a Cloos QineoChamp, with welding speed vS=16 mm/s, and a filler wire diameter of 1.6 mm.
The joints were welded with different penetration depths in the web plate. Technically, these different penetration depths were realized by creating gaps of 0.0 mm, 0.6 mm and 1.2 mm between web and belt plate. Gaps of 0.6 mm and 1.2 mm were forced with inserted spacer plates. Please note, that some gaps were opened in the weld root completely. In other words, the penetration depths are varying strongly. In this paper, the penetration depth is denoted by the symbol “s”, whereas the gap size is symbolized by the letter “z”.
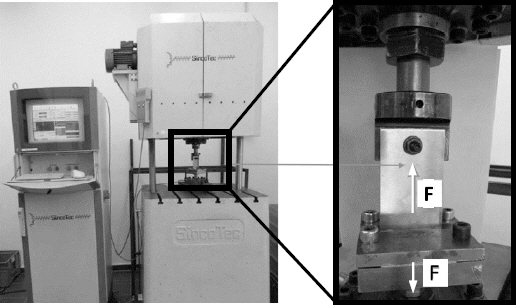
Fig. 1 shows the described welding setup, the clamping used, and the Zwick Roell table-top testing machine Z050 which was used for the static tests.

Welding setup, zwick roell static test device Z050, associated clamping device with specimen
Dynamic loads were carried out on a Sincotec Power- Swing resonance testing machine. The frequency of the tests was f=40 Hz. In Fig. 2 the test stand and a clamped specimen are shown. The studied T-joints have a width of 60±1 mm. Seam entry and exit were cut off the specimens and hence, their influence on the strength is not considered in this study. The edge areas were glass bead blasted to round sharp edges and create local compressive residual stresses.
Resonance testing machine sincotec power swing 50 kN, f=40 Hz, with clamped sample
3. Static investigation results
In Fig. 3 cross-sections of the T-joint specimens, and their corresponding experimentally measured ultimate tensile strengths (UTS) are compared, for the welding processes under investigation. For two different penetration depths, UTS levels can be determined independently of the filler material. Since the tensile strength presented in Fig. 3 refers to the cross-section of the web plate, the measured UTS correlates to the size of the area of the cross-section. This means, by increasing penetration depth, the measured UTS increases as well. Surprisingly, it turned out that the welding processes, its execution and the filler material have a minor influence on the strength.
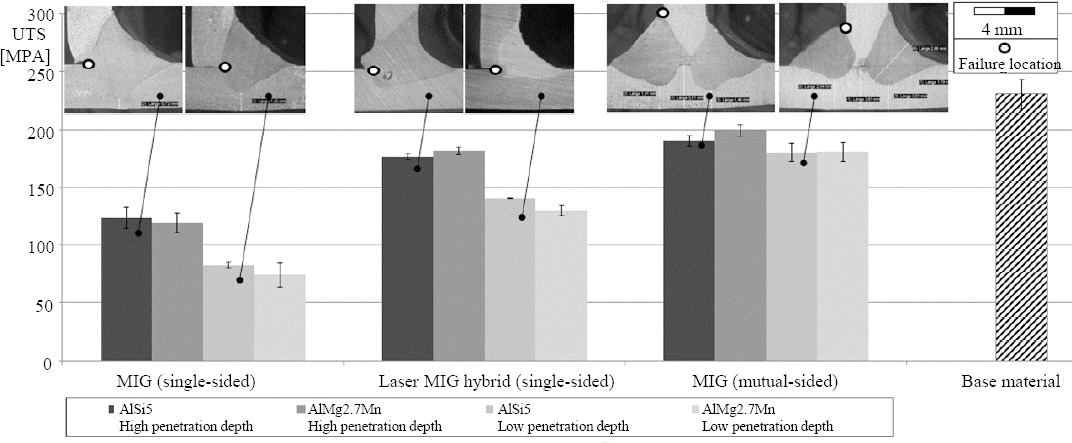
Static strength test results for the MIG single-sided, mutual sided, Laser MIG hybrid specimen and the base material
The maximum strength of the joint cross-section was realized by the laser MIG hybrid welds and MIG welds with opposing layer. However, these approaches did not achieve the strength of the base material. More precisely, MIG welds with opposing layer achieve an UTS to be approximately 30 MPa (“high penetration depth”) to approximately 50 MPa (“low penetration depth”) higher than the UTS of specimens welded using the laser MIG hybrid process, cf. Fig. 3.
4. Dynamic investigation results
In the following the results of the cyclic testing (viz. the fatigue strength) are presented. Fig. 4 shows cross- sections of the low and high penetration depths s in the web plate. In addition, the corresponding Woehler lines from the tensile test at (almost) pulsating load (R=0.1, f=40 Hz) at the T-joint, for a 50 % failure probability PA,50 of the joint are plotted.
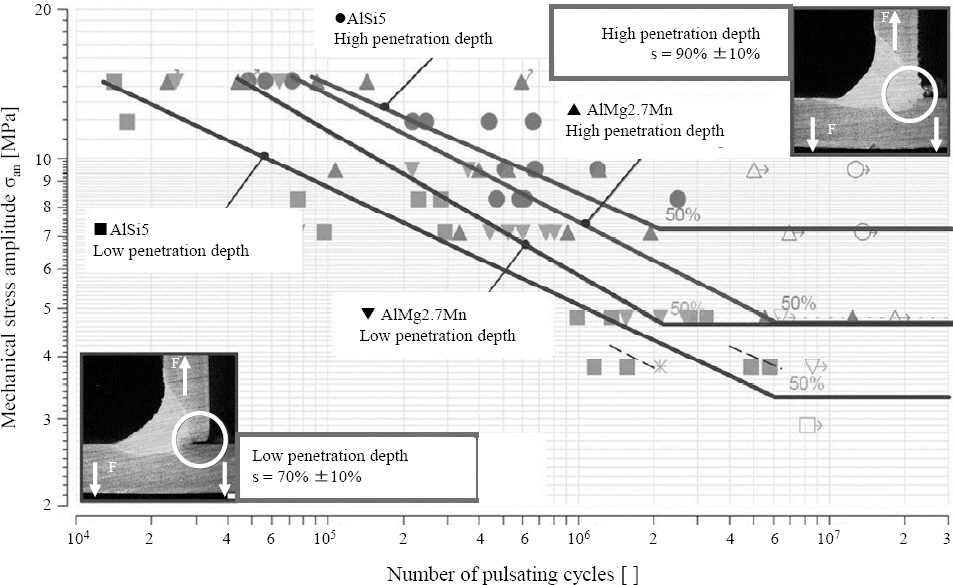
Woehler line from tensile pulsating tests (R=0.1) at the T-joint, variation of the penetration depth
The fatigue strength, i. e. the Woehler lines, of the specimens with the high penetration depth is above those of the low penetration depth. For the high penetration depth, the specimens of the AlSi5 filler material yield a higher load level compared to those of the AlMg2.7Mn filler material. This is reversed in the case of low penetration depths.
The increased scatter margins with TN≈5.5 to TN≈7.8 (Amount of specimen n=4) are noticeable. Therefore, failure modes of extrema are considered in more detail. During the tests, all specimens failed exclusively starting from the weld root. Fig. 5 shows the fracture initiation points of individual specimens.
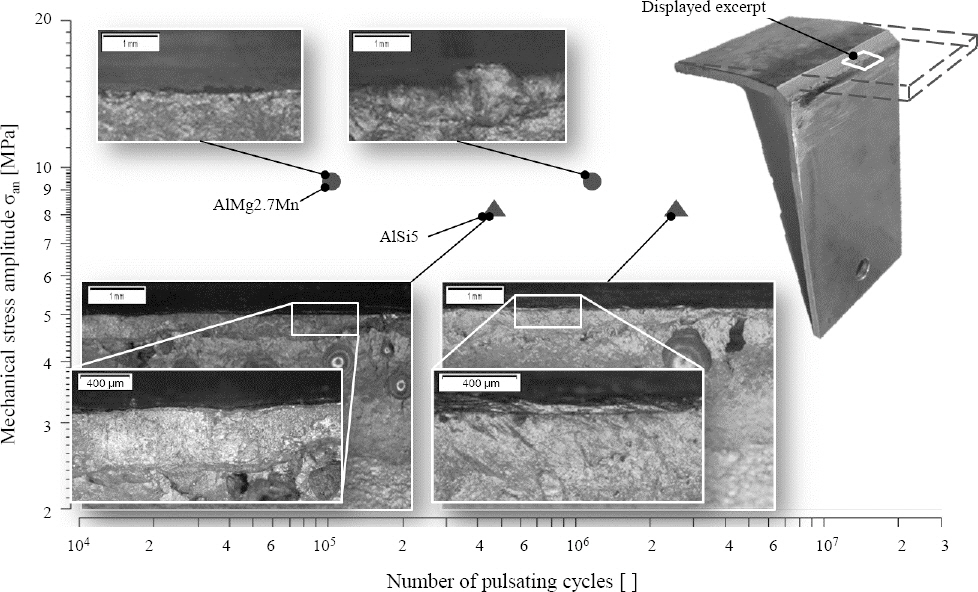
Woehler line from tensile pulsating tests (R=0.1) at the T-joint, observation of weld root connection at fracture surface
For specimens of both filler materials, the extreme values of the fatigue strength of a load level are shown in each case. It turned out that specimens with a low fatigue strength show thermally influenced but not bonded seam roots (mean weld depth s¯≈89 %, n = 3). In contrast, the seam roots of the samples with a late failure are recorded (s¯ ≥100 %, n=3).
The separate consideration of the extrema shows a clear influence of root connection. As expected, a fully bonded weld root significantly increases the fatigue strength.
The appearance of pores is a typical side effect of welding. In the samples with a fully bonded root, pores with sizes up to an average diameter of 0.8 mm occur. The partially bonded samples possess significantly more pores, but the size of these pores is smaller with an average diameter less than 0.6 mm. An influence of the filler materials used on the number and size of the pores could not be observed.
In summary, it may conclude that the principal effect on the fatigue strength is the welding depth.
5. Decided gap influence observations
In this section, the gap influence on threshold loads is considered in detail. The welds of the specimens are carried out with varying gap dimensions zgap, but otherwise constant welding process parameters. As filler material AlSi5 was used, the welding speed was set to vs = 40 mm/s and the gap width zgap=0.6 mm was enforced. These process parameters will be referred to as PLLH (zgap=0.6 mm) in what follows.
In addition to the laser MIG hybrid specimens, here MIG specimens in a single layer and counter layer were also analyzed. The set gaps are zgap=0.0 mm, zgap=0.6 mm, and zgap=1.2 mm. Independent of the gap zgap being present on the sample, the aforementioned parameter set PLLH (zgap=0.6 mm) was used. These parameter set was adjusted for an optimal connection of the web plate. In other words, it was expected that the joint’s strength yields a maximum while at the same time the number and size of imperfections is minimized. The phrase “imperfections” summarizes notches, pores and cracks in the connection. It was observed that cracks in the belt plate occur when the remaining wall thicknesses is less than one millimeter.
Furthermore, laser MIG hybrid samples with PLLH (zgap=0.0 mm) at the gap zgap=0.0 mm were investigated for better comparability.
Fig. 6 summarizes the mentioned gaps, process variables and cross-sections of the MIG and laser MIG hybrid specimens used.
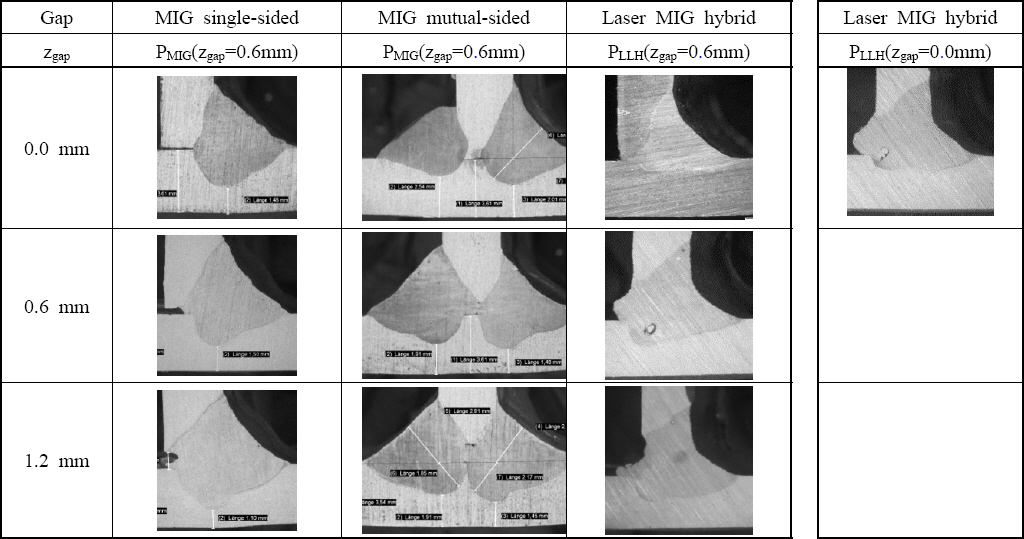
Cross-sections of welded T-joint specimens, welding process Laser MIG hybrid and MIG in one and mutual layer, base material EN AW-5454, filler material AlSi5, h=3.5 mm
Results of the tensile fatigue tests are presented in what follows. In Table 1 the systematics of the investigation is shown, whereas Fig. 7 presents the Woehler curves of the single layer MIG welds.
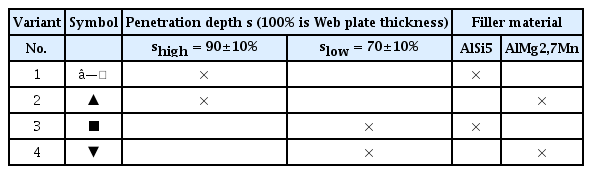
Specimen variants with different welding depths and filler materials
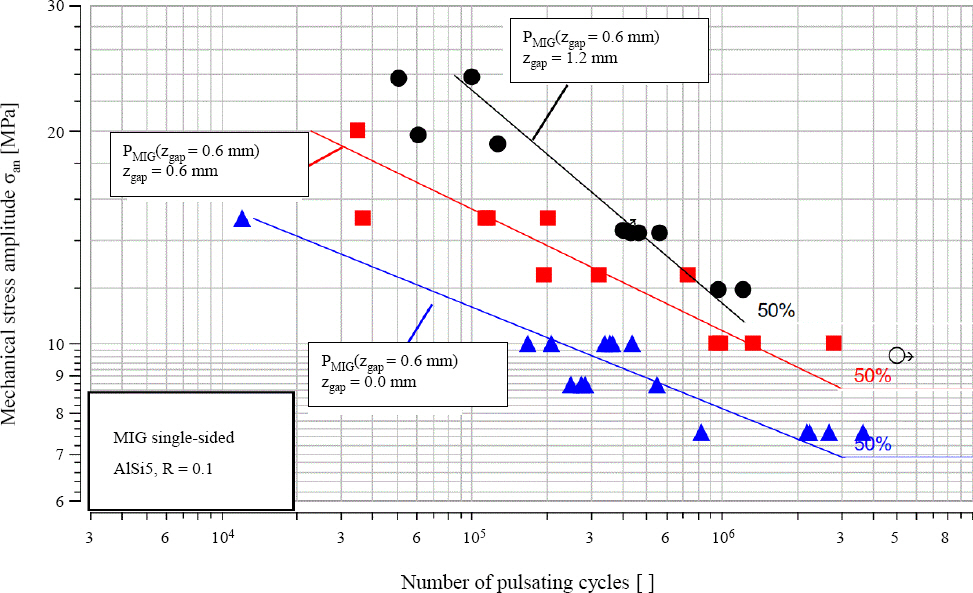
Woehler line from tensile pulsating tests (R=0.1) at the T-joint, MIG welds with gaps of zgap=0.0, zgap=0.6 mm and zgap=1.2 mm
As the gap size decreases, the number of tolerable load cycles increases. This correlation is reasonable since the steady rise of the penetration in the web and belt plate. The divergence of the Woehler lines for decreasing numbers of load cycles is noticeable. This indicates that the gap has a different influence in the Low Cycle Fatigue (LCF) compared to the High Cycle Fatigue (HCF).
The determined Woehler lines of the laser MIG hybrid samples are shown in Fig. 8. Noticeable are the samples PLLH (zgap=0.6 mm) with zgap=0.0 mm. Compared to the other Laser MIG hybrid samples in the HCF regime, these show a significantly lower fatigue strength. Strictly speaking, the fatigue strength is comparable to the MIG specimens. A reason for that might be the reduced welding depth which results from the usage of the PLLH (zgap=0.6 mm) at the gap with zgap=0.0 mm. Among other things, a lower laser power is used than with the process parameter set PLLH (zgap=0.0 mm). The reduced welding depth, in combination with the small notch radius, causes a complicated structure at the weld root. To predict the lifetime of such a structure, fracture mechanics approaches are used oftentimes.
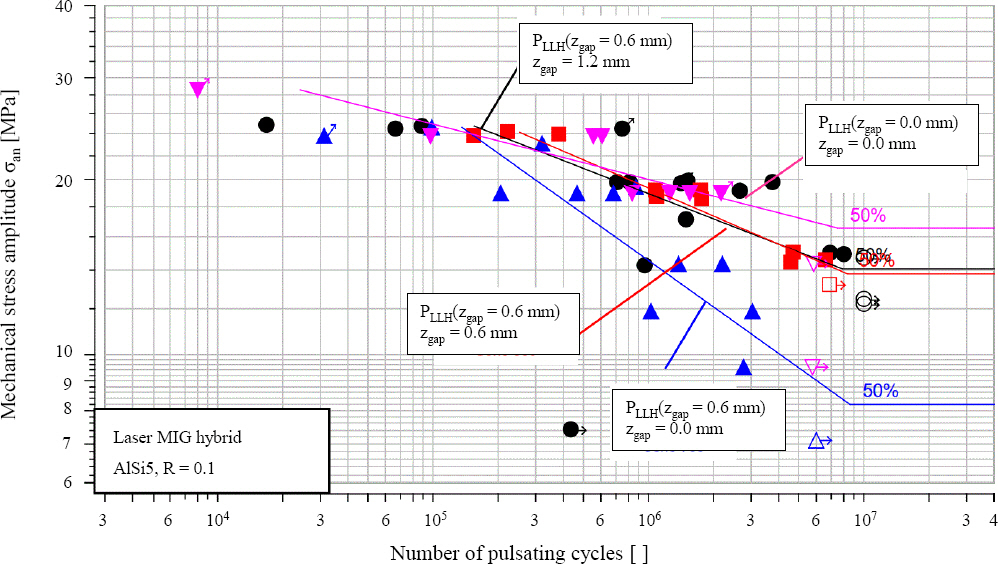
Woehler line from tensile pulsating tests (R=0.1) at the T-joint, Laser MIG hybrid welds with gaps of zgap=0.0, zgap=0.6 mm and zgap=1.2 mm.
In contrast to PLLH (zgap=0.6 mm) with zgap=0.0 mm, the samples PLLH (zgap=0.0 mm) with zgap=0.0 mm do not show any reduced welding depth. The weld root is bonded completely in this case, and the threshold strength of these specimen group is relatively the highest.
The Woehler lines of the samples PLLH (zgap=0.6 mm) with zgap=0.6 mm are characterized by a low scattering span TN=3.2 and an increased fatigue strength by a factor of two compared to the single-layer MIG samples.
For the samples PLLH (zgap=0.6 mm) with zgap=1.2 mm, there is on average no decrease in the fatigue strength compared to the samples with zgap=0.6 mm. However, the scatter span TN increases many times to TN=25.3. A large scattering span can be disadvantageous for the design of joints if they are designed for low failure probabilities.
The failure locations of the specimens joined on one side using the laser MIG hybrid or MIG process are the same in both cases, the static and dynamic respectively. Cracks initiate in the transition area between web and belt plate and propagates through the joint’s root. Fig. 9 illustrates typical examples.
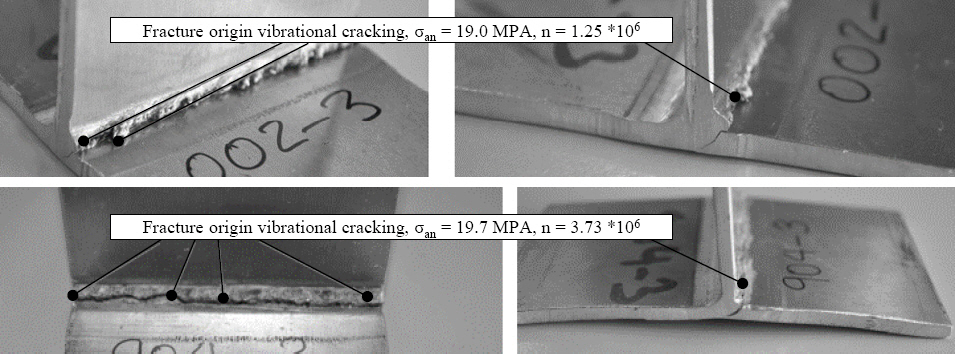
Fracture origin on two specimens, specimen PLLH(zgap=0.0 mm) with zgap=0.0 mm (top), specimen PLLH (zgap=0.6 mm) with zgap=1.2 mm (bottom)
Separate levels of the nominal stress amplitude σan can be identified for the specimens. Clearly, the level of the MIG mutual-side welded specimens is the highest compared to the other specimens. More precisely, the strength is about a factor of two higher than that of the laser MIG hybrid specimens. The level of the laser MIG hybrid specimens are again approximately two times higher than that of the MIG specimens. For the nominal stress amplitude, the relation “MIG mutal-sided welded > MIG hybrid welded > MIG welded” holds.
6. Summary and Conclusion
Strength investigation methods for fillet welded EN AW-5754 aluminum T-joint specimens under static and pulsating loads were conducted and the results are presented in this paper. A major influence on the static and dynamic strength is the design of the weld, respectively whether there is a root gap or a root capture. If the web plate is welded through, there is also a smaller number and size of pores. The influence of the filler materials AlSi5 and AlMg2.7Mn used on the strength, though, is small.
It is not sufficient to use an invariant set of process variables for the gaps 0.0 mm to 1.2 mm. If highest strengths are desired, welding parameter switching is necessary for gaps >0.6 mm. The aim of parameter switching to achieve a weld root penetration.
For the MIG process, a parameter adjustment should happen at a change of 0.6 mm. The laser MIG hybrid process only requires adjustment for the 0 mm gap. The MIG mutual-sided welding does not need any adjustment. This applies for the gap in the range from 0 mm to 1.2 mm. With MIG mutual-sided welding, the largest cross- sections, the smallest notches, and the highest strength can be achieved.