Numerical Simulation of Transport Phenomena for Laser Full Penetration Welding
Article information
Abstract
In laser full penetration welding process, full penetration hole(FPH) is formed as a result of force balance between the vapor pressure and the surface tension of the surrounding molten metal. In this work, a three-dimensional numerical model based on a conserved-mass level-set method is developed to simulate the transport phenomena during laser full penetration welding process, including full penetration keyhole dynamics. Ray trancing model is applied to simulate multi-reflection phenomena in the keyhole wall. The ghost fluid method and continuum method are used to deal with liquid/vapor interface and solid/liquid interface. The effects of processing parameters including laser power and scanning speed on the resultant full penetration hole diameter, laser energy distribution and energy absorption efficiency are studied. The model is validated against experimental results. The diameter of full penetration hole calculated by the simulation model agrees well with the coaxial images captured during laser welding of thin stainless steel plates. Numerical simulation results show that increase of laser power and decrease of welding speed can enlarge the full penetration hole, which decreases laser energy efficiency.
1. Introduction
Laser keyhole welding is a highly efficient and clean joining method widely used in industrial manufacturing. Compared to other welding process, it has many advantages such as high speed, high aspect ratio and narrow heat affected zone. During laser welding process, both melting and evaporation take place, and the evaporation recoil pressure pushes the melted material flow outwards. The coupled effect of evaporation and recoil pressure forms a cavity called keyhole. Multi-reflections of laser beam occur inside the keyhole, which further promotes evaporation and deepens the keyhole. When the welding plate is thin enough, a full penetration hole(FPH) as Fig. 1 shows can be formed. However, full penetration hole only exists during welding process.
Schematic of laser keyhole welding modes. (a) blind keyhole welding, (b) full penetration welding
Numerous experiments have been carried out to monitor the keyhole dynamics by former researchers. Among these experiments, high speed cameras are widely used to capture the surface phenomena of workpiece1-3). By using the X-ray real-time imaging system, keyhole wall dynamics can be observed4,5). Technique to monitor full penetration hole dynamics is similar to the one to observe keyhole dynamics, while several research efforts have been done with vision system. Fabbro et al (2005)6) analyzed the dynamics of the keyhole and its complete geometry (front wall inclination, top and bottom apertures) by using on axis visualizations through the top and the bottom of the keyhole with a high speed video camera. Blug et al (2011)7-9) investigated coaxial images of laser full penetration welding, extracted full penetration from coaxial images and developed a close loop control system to improve laser full penetration welding quality. Similarly, Zhang et al (2013)10) studied the full penetration hole dynamics using an auxiliary illuminant.
However, limited information of keyhole dynamics can be achieved by experimental method. To gain a better understanding of the laser welding process, many modelling studies have been performed concerning different characteristics. Level-set method(Osher and Fedkiw, 200111)) and VOF method(Hirt and Nichols, 198112)) are widely used to track the interface of keyhole wall. Ki et al. (2002)13) modeled the keyhole by the level set method and showed an improved total laser absorptivity for both laser drilling and welding. Lee et al. (2002)14) investigated the the mechanisms of keyhole formation and instability with the volume of fluid (VOF) method. Zhou et al. (2006)15) studied the defect formation mechanisms in pulsed laser welding of zinc- coated steels with VOF method. Dasgupta et al. (2007)16) developed an adaptive mesh model to reduce computation load in simulation of laser welding of zinc coated steels. Amara et al. (2008)17) studied the effect of gas jet on the flow pattern of melt pool. Cho et al. (2009)18) studied the flow pattern evolution when laser weld change from conduction mode to keyhole welding mode. Zhao et al.19) investigated the formation of keyhole-induced porosity. Tan et al. (2013)20) used the ghost fluid method to deal with the jump condition across the liquid vapor phase interface.
For full penetration welding, although the governing equations of transport phenomena are the same as laser welding in a conduction mode or a blind keyhole mode, the challenge remains in the dynamic evolution of the keyhole when a full penetration occurs. Some early works focused on the simplified model assuming that the effect of melt ejection due to evaporation recoil pressure weld pool is weak21-23). Geiger et al. (2009)24) investigated the full penetration welding with Open FOAM® software package, however, no quantitative analysis was presented in this work.
To analyze the shape and dimension of full penetration hole, a three-dimensional transient model is proposed to simulate the dynamics of FPH. Mass conserved level set model is used to track the evolution of phase interface, and ghost fluid method and continuum method are implemented to deal with Liquid/Vapor (L/V) interface and Solid/Liquid (S/L) interface boundary conditions. The model is then validated by experimental results. The effects of processing parameters, such as welding speed and laser power, on molten pool geometry are investigated. The effective absorptivity of laser beam energy after penetration is analyzed through the simulation.
2. Mathematic model
A schematic of the laser full penetration welding is shown in Fig. 1(b). In this simulation model, the substrate is moving forward in a three-dimensional Cartesian coordinate at a constant speed V, while laser beam is stationary. A laser beam with a Gaussian profile is used as the heat source, which is focused on the substrate surface with a spot size of 0.4 mm. When laser beam is on, the high power laser beam will heat a small area of the substrate and produces a molten pool. The fluid flow in the molten pool is assumed to be incompressible Newtonian fluid. The fluid flow is considered to be laminar and is driven by the buoyancy force, Manangoni force, and surface tension on the molten pool surface. The thermal-physical properties of the substrate are assumed to be temperature dependent.
2.1 Free surface tracking
Level-set method is proposed by Osher et al.25), then it is widely used in surface tracking. Compared with VOF, level set method can calculate the surface position and surface normal in a more precise way. Therefore level set method is used to track the evolution of the molten pool free surface in this work. The general form of the level-set equation is
where Ve is the free surface movement velocity caused by evaporation and
However, level set method is not mass-conserved when dealing with multiphase flow. Many methods have been proposed to solve the mass loss problem, such as adding constraints into the original level set equation26), using the coupled level set and volume fluid methods27). Wen et al.28) proposed a simple but effective way when dealing with laser cladding by multiplying level set equation and the mass conservation equation. This equation is achieved by making eq. (1) * ρ equal to eq. (14) * Φ. The same corrected level set equation is used here.
In order to reduce the numerical errors caused by both steepening and flattening effects, the level set function should be reinitialized periodically throughout the calculation. The initialization equations used in this paper are
2.2 Ray-tracing model
When keyhole is formed, multi-reflection of laser beam cannot be neglected. Laser energy will be focused is the center of keyhole which deepens the keyhole rapidly. To simulate the multi-reflection in the keyhole, the ray-tracing method is used. In this model, laser beam is divided into a finite number of rays, and when it comes across the keyhole wall, the reflected ray is expressed as
Here
Upon each ray incidence, laser energy will be partially absorbed on the keyhole wall through Fresnel absorption, and the total absorbed energy is the sum of all incident ray, as formulated in equation7)
where Ii,j is the incident laser energy at point (xi, yi), and the Fresnel absorption coefficient α can be calculated as a function of the incident angle θ in equation
where ε is a material constant related to its electrical conductance. The laser beam is assumed to be Gaussian distribution, and the beam profile and radius do not change in the z direction, so Ii,j can be expressed as
where P is laser power and r is laser beam radius.
2.3 Evaporation model
Near the laser material interactive interface, there exists a thin layer where the pressure, temperature and material property across the interface varies a lot. This layer is called Knudsen layer. The mathematic model of Knudsen layer was derived by Knight29) and was thoroughly described by Ki13,30).
The temperature jump can be calculated as
where γ is the ratio of specific heat,
in which ρs is the saturation density at liquid surface temperature Tl, and β is the modification factor concerning back-scattered flux. The recoil pressure at the keyhole wall can be calculated as
Where ps(Tl) is the saturation density at liquid surface temperature Tι.
2.4 Heat transfer
The energy conservation equation is described as
where the source term q represents the energy changes. The energy source is mainly on the liquid/gas interface, and it includes laser energy absorbed qlaser and energy transported due to melting, evaporation and thermal emission as
where me is the mass loss due to evaporation, and L is the latent heat of evaporation, σ is the Stefan-Boltzmann constant and equal to 5.67×10⁻⁸W/m2·K, and ε is the material emissivity, δ(Φ) is the derivative of Heaviside function of the level set values called delta function as
2.5 Fluid flow
The generalized transport equations are mass conservation and momentum equations
In the mass conservation equation, ρ is the density and
where K0 is a constant determined by the morphology of the mushy zone. The fourth term on the right side of Eq. (14) is the capillary and Marangoni forces on the L/V interface. Since they are surface force, they can be incorporated into the momentum equation by multiplying with δ(Φ) as defined in Eq. (12).
2.6 Boundary conditions
Three phases are considered in this model, the conditions of phase interface is complex to deal with. During laser welding process, the major difference between the solid and liquid phases is the physical properties, such as density, viscosity, etc. Therefore, continuum method is applied to deal with solid/liquid interface. However, besides density and viscosity discontinuities, jump discontinuities of pressure and temperature exist on the liquid and vapor interface. Continuum method cannot deal with the L/V interface very well. Therefore the ghost fluid method is applied on the L/V interface.
2.6.1 Continuum method on solid/liquid interface
Continuum method applied on the solid/liquid interface treats the two phases as the same. So the properties are smoothly changed across the interface. The density ρ, thermal conductivity k, dynamic viscosity μ, and specific heat Cp in the liquid/vapor transition region are expressed as
in which subscripts m, l and s denote mushy, solid and liquid phases and fl and fs are the solid and liquid mass fractions of material. fl is defined as
where Ts is solidus temperature and Tl is liquidus temperature.
2.6.2 Ghost fluid method on liquid/vapor interface
Ghost method is widely used in two phase flow to deal with contact discontinuity. The basic idea of the ghost fluid method is to generate a ghost cell at the location of the real cell near the interface as Fig. 2 shows, and this ghost cell will be used for discretization instead of the real cell. The physical properties of the ghost cell is equal to the fluid cell. Since the jump of properties such as pressure and temperature can be calculated by evaporation model, the value of ghost cell can be calculated as
Ghost node in ghost fluid method. (a) ghost liquid cell, (b) ghost vapor cell
3. Numerical implement
To solve this mathematic mode, a finite volume method based FORTRAN code is developed. The solution procedure is illustrated as Fig. 3 shows. First, calculate the time step of this loop. The time step should satisfy the Courant-Friedrichs-Lewy (CFL) restriction, as Eq. (19) shows.

Flow chart of numerical model in this paper
The level set equation are solved based on the velocity field calculated in the last loop. According to the updated Φ, normal vectors and curvature can be calculated. Then the ray-tracing model and evaporation model are called to update the boundary conditions based on the updated Φ and the hydrodynamic solution from the last loop. The solution of the ray-tracing model and evaporation model are applied as the boundary conditions of the heat transfer equation and the hydrodynamic equations.
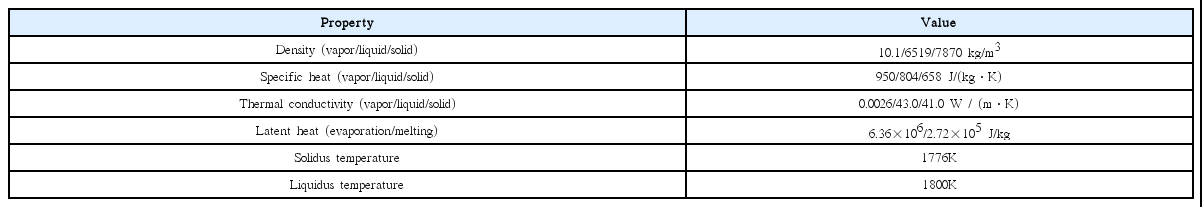
Main material properties of 304 stainless steel
In this numerical model, the computational domain is taken as a symmetric half of the laser welding geometry with respect to the Y axis. The domain size is set as 8×5×10 mm in X, Y, and Z directions, respectively, corresponding to a non-uniform grid. The overall computation domain is divided into three parts along the Z coordinate axis: gas phase (Z=0), solid phase (-0.1 ≤ Z ≤ 0.0) and gas phase (Z<-1.0). The region around laser beam is meshed in fine size, and other regions are meshed in coarse size. To reduce the computation load, the substrate with the coordinates is moving along the X axis instead of moving the laser beam.
4. Simulation results of full penetration hole
The dynamics of keyhole behavior during laser welding process is rather complex, limited methods can be used to observe it. With the help of numerical model, the simulation results can be achieved graphically. Moreover, the effects of laser processing parameters on keyhole behavior can be investigated conveniently. In this paper, the effects of laser processing parameters, such as laser power and welding speed, on the diameter of a full penetration hole is studied and verified by the experimental results.
4.1 Formulation of full penetration hole
Fig. 4 shows the dynamic evolution of the temperature field and shape of the keyhole during a full penetration laser welding process with a laser power of 2kW and a welding speed of 2 m/min. As shown in Fig. 4(a), when the laser beam turns on from the initial position, the temperature of the substrate surface increases quickly to the melting temperature, and a small keyhole forms. The depth of keyhole increases as a result of recoil pressure and Marangoni effect. Compared with Fig. 4(b) and Fig. 4(c), the variation rate of keyhole depth increase as the keyhole is deeper due to the multi-reflection effect in the keyhole wall. As a full penetration break through is finally achieved, and a through hole forms as Fig. 4(d) shows. When full penetration takes place, the recoil pressure decreases fast, so the molten metal around the surface shrinks due to the surface tension. Sometimes, the molten metal may stick together in the key hole as Fig. 4(e) shows. The plate will break through again quickly, and this time the variation of recoil pressure is relatively small, therefore no obvious shrinkage occurs this time as shown in Fig. 4(f). Then the profile of a full penetration hole varies slightly, the metal on the back plate is melted as Fig. 4(g) shows. Finally the full penetration hole stabilized and the profile of full penetration hole reaches dynamic balance as shown in Fig. 4(h). Due to the moving velocity of plate, a tail full of molten metal is formed as Fig. 4(h) shows.
Dynamic evolution of the temperature field and the shape of the keyhole wall during full penetration welding with laser power = 2kW, welding speed = 2m/min.(color map unit in K)
4.2 Effects of processing parameters on full penetration hole diameter
The influence of the welding speed and laser power on the characteristic dimensions of the full penetration hole was investigated through the simulation model as shown in Fig. 3. The full penetration hole diameter of simulation model can be achieved intuitively from the top view of the plate as Fig. 5 shows.

Full penetration hole from top view.(color map unit in K)
The relationship between FPH diameter and laser power, welding speed is shown in Fig. 6. At a constant from 1.5m/min to 2.5m/min makes the diameter of full penetration hole decrease from 0.27mm to 0.18mm. And with constant welding speed of 2m/min, an increase of laser power from 1.4kW to 1.8kW makes the diameter of full penetration hole increase from 0.19mm to 0.26mm. When the welding speed increases, the keyhole wall tends to have a taper angle as shown in Fig. 7. As a result, the diameter of full penetration hole decreases.

Influence of laser power and welding speed on the diameter of full penetration hole
Profile of keyhole wall when the welding speed is 6m/min.(color map unit in K)
4.3 Experimental verification
Full penetration hole is formed during welding process. However, when laser beam is closed, it will disappear due to capillary effect as Fig. 8 shows. An effective way to observe the penetration hole is through a coaxial imaging system with the laser beam delivery optics. However, the light emission on the welding front is too strong to observe directly. A 700nm optical filter is used to observe the dynamics of welding front. The result images are shown in Fig. 9-10. The white region is molten metal and the center black region is full penetration hole. With appropriate image processing algorithm, the diameter’s value can be calculated.

Sample plate of full penetration welding

Coaxial image sequence. (a) laser power 1400W, welding speed 2m/min, (b)laser power 1600W, welding speed 2m/min, (c) laser power 1800W, welding speed 2m/min

Coaxial image sequence. (a) laser power 1600W, welding speed 1.5m/min, (b)laser power 1600W, welding speed 2m/min, (c) laser power 1600W, welding speed 2.5m/min
The influence of the welding speed and laser power on the diameter of full penetration hole was investigated through experiment. The full penetration hole becomes lager when laser power increases, while it becomes smaller when the welding speed increases. The effects of welding speed and laser power are illustrated in Fig. 11-12. At a constant laser power of 1600 W, an increase of the scanning speed from 1.5 m/min to 2.5 m/min makes the diameter of full penetration hole decrease from 1.10 mm to 0.95 mm. With a welding speed of 2m/min, the increase of laser power from 1600 W to 2000 W makes the diameter of full penetration hole increase from 0.2 mm to 0.8 mm. The simulation results and experiment results match each other very well.
Comparison of full penetration hole diameter between simulation and experiment results with welding speed equal to 2m/min, and laser power equal to (a) 1400W, (b)1600W, (c)1800W

Comparison of full penetration hole diameter between simulation and experiment results with laser power equal to 1600W, and welding speed equal to (a) 1.5m/min, (b)2m/min, (c)2.5m/min
5. Discussion
5.1 Energy distribution during full penetration welding
The laser absorption intensity distribution on the keyhole wall is shown in Fig. 13. Before penetration, there are three typical regions in terms of absorption intensity. The absorption of bottom region is the highest, since energy is concentrated at this place due to multi-reflection effects. The second region is the side wall of keyhole. The absorption of this region is very low, because the power of laser beam in this region is low, and the incident angle is so large that the absorption rate is small. The third region is the top surface of the molten pool. This part of the liquid surface can be directly irradiated by the incident beam, but the overall absorption energy is low because laser beam in this region carries low energy. Once the keyhole breaks through the plate, the energy in the bottom region leaks out. However, since the keyhole wall has a slanted wall due to movement of plate, the energy in the second region is the largest as Fig. 16b shows.

Laser energy distribution (a) before penetration; (b)after penetration.(color map unit in W/m2)
5.2 Energy efficiency during full penetration welding
The energy efficiency of laser beam during laser full penetration welding is investigated. Variation of overall laser efficiency with time is illustrated in Fig. 14. It typically can be divided into three phases. The first one is the increasing phase. Before penetration, laser beam moves in the keyhole with multi-reflection effect, and the effect is strengthened when the depth is larger. Therefore, the energy efficiency increases with time. The second phase is the oscillation phase. After penetration, the pressure in the keyhole varies a lot, which cause the oscillation of keyhole wall. Since there is no steady keyhole wall, the laser beam travels in the keyhole with changing path, so the energy efficiency is oscillation. The third phase is the steady stage. The keyhole wall reaches dynamic balancing finally, and the path of laser beam is steady, so the energy efficiency is steady. However, there is energy leakage in the center of keyhole, so the final energy is relatively low.

Laser energy efficiency with time
Similar to the diameter of full penetration hole, the influence of laser welding speed and laser beam power on energy efficiency is investigated as shown in Fig. 15. With a laser power of 1.6kW, the increase of laser welding from 1.5m/min to 2.5m/min makes the energy efficiency increase from 0.114 to 0.144. And the increase of laser power from 1.4kW to 1.8kW makes the energy efficiency decrease from 0.153 to 0.119 when welding speed is limited to 2m/min.

Influence of laser power and welding speed on the laser energy efficiency
6. Conclusion
A comprehensive, three-dimensional, self-consistent transient model has been developed to investigate the keyhole evolution during laser full penetration welding, and validated against experiments. The model has taken into account the complex boundary conditions and physical phenomena such as heat transfer, fluid flow, melting, and solidification. The effects of the laser power, and welding speed on the diameter of full penetration hole are investigated and compared to the coaxial images. The results show that the increase of welding speed will decrease the FPH diameter and the increase of welding speed leads to smaller full penetration hole.
Finally, the energy efficiency is investigated, and the influence of laser power and welding speed is predicted. Combining all the above results, it is shown that the energy efficiency has a positive correlation FPH diameter. Specifically speaking, with a laser power of 1.6kW, the increase of laser welding from 1.5m/min to 2.5m/min makes the energy efficiency increase from 0.114 to 0.144 and the FPH diameter decrease from 0.27mm to 0.18mm. And the increase of laser power from 1.4kW to 1.8kW makes the energy efficiency decrease from 0.153 to 0.119 and the FPH diameter increase from 0.19mm to 0.26mm when welding speed is limited to 2m/min. Since the full penetration hole can be observed with the help of coaxial imaging system, so this model can guide the optimization of laser full penetration welding process.