


1. Introduction
Resistance spot welding is an economical and highly productive welding process in the automotive industry. Resistance spot welding is mainly used for automobile body welding, but it is also applied to aircraft and home appliances. As the application of new high-strength steel plates and lightweight materials increases, the demand for monitoring the welding quality of new materials is growing. This increasing demand has led to abundant research on resistance spot welding process monitoring technology. Through the application of welding process monitoring technology, it is possible to improve the quality of welds, reduce the reject rate, and improve the work efficiency of welding operators. Based on the characteristics of the resistance spot welding process, the factors that can be monitored are the current, the dynamic resistance value using voltage measurements, the displacement of the welding electrode, and the indentation that occurs after welding. Among the monitoring technologies of the resistance spot welding process, the monitoring of dynamic resistance, which is the most commonly used monitoring technology, acquires changes in the dynamic resistance value as the welding time changes through the measurement of current and voltage values during the resistance spot welding process, and identifies the characteristic points, which can be used to predict or identify the mechanical properties and expulsion of the weld. Another monitoring technology is a technology that measures the electrode displacement according to the change of welding time, which is characteristic of the resistance spot welding process, using a Linear Variable Displacement Transducer (LVDT) sensor, and uses the results to predict the welding quality. Furthermore, the indentation that occurs after welding, which is another characteristic of resistance spot welding, can be used to predict the quality of the weld by analyzing the image acquired using a camera sensor. Recently, there has been a growing interest in research on monitoring technology that uses artificial intelligence to collect and analyze various data generated during the welding process to predict the quality of the weld. In this paper, we will introduce the latest trends in monitoring technology for resistance spot welding process, focusing on domestic technology. For reference, non-destructive testing technology, which is widely used to evaluate welding quality, is classified as a field in its own right and is excluded from the technology trend survey in this paper because it is necessary to identify technology trends.
2. Main Discourse
2.1 Real-time welding quality monitoring technology using dynamic resistance measurement
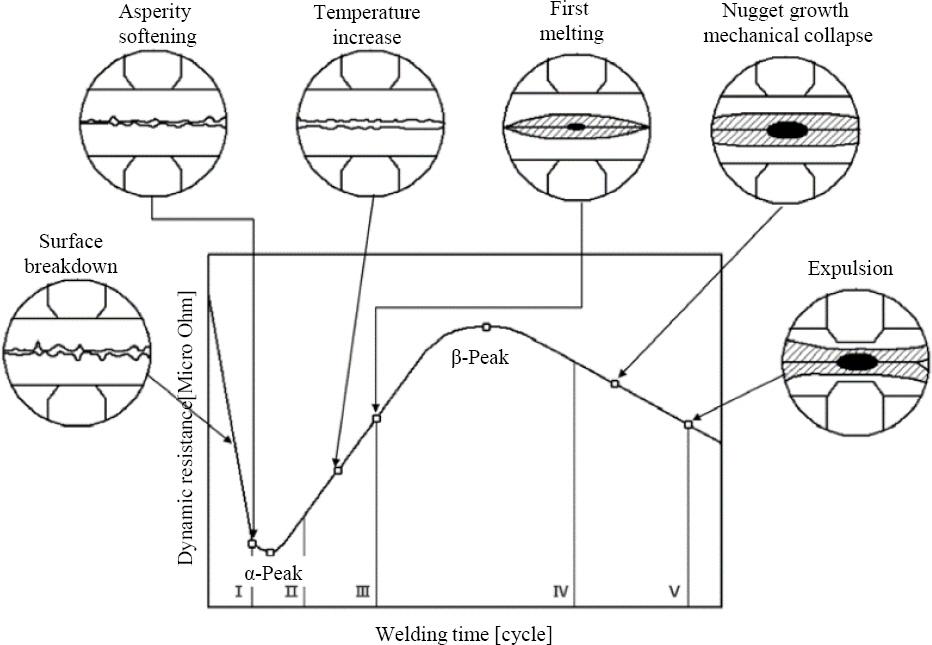
There has been abundant research on monitoring technology for resistance spot welding, such as real-time welding quality monitoring using dynamic resistance measurements based on welding voltage and current signals. A survey of domestic and foreign papers shows that the main focus of research is on models to predict the strength or nugget diameter of resistance spot welding using dynamic resistance measurements. Fig. 1 shows a typical dynamic resistance curve of the resistance spot welding process. From the dynamic resistance curve, the pattern of dynamic resistance can be classified into five phases as the welding time changes, and the growth of the nugget can be predicted. Phase I is characterized by a rapid decrease in resistance due to the decay of metal contaminants on the metal surface at the same time as the initial energization of the welding current. In phase II, the contact area increases as the surface roughness of the contact surface disappears, and the resistivity increases as the temperature of the contact increases while the resistance of the weld decreases. At this point, the two changes in resistance reach equilibrium and the ╬▒-peak Haiyang appears. After this, the dynamic resistance continues to increase due to the increase in specific resistance as the temperature increases. This is followed by phase IV, in which melting begins at the contact surface and a nugget is formed, and a ╬▓-peak Haiyang appears, in which the increase in resistivity at the contact is balanced by an increase in the energized area and a decrease in resistance due to plastic deformation. After that, it enters the V stage where the dynamic resistance decreases due to nugget growth and thickness reduction, and finally expulsion occurs. In this way, nugget growth can be predicted by extracting feature points of the dynamic resistance curve as a function of welding time.
Shin1,2) monitored the dynamic resistance pattern using secondary circuit process variables detected when performing resistance spot welding of 1.2 GPa ultra-high tensile TRIP steel plate, and based on this, extracted 10 factors as shown in Fig. As shown in Fig. 2, 10 factors necessary for evaluating welding quality were extracted. Based on this, a model to predict the nugget diameter through regression analysis was presented.

Ku3) introduced a technique to obtain the thermal energy by extracting the ╬▓-peak, which is the point where melting starts and nugget generation starts, from the dynamic resistance curve and use it to monitor the quality of resistance spot welding. In this study, the thermal energy was defined as the amount of energy up to the ╬▓-peak, and the thermal energy up to the ╬▓-peak was obtained from a dynamic resistance curve with a clearly defined peak, and then used to extract the ╬▓-peak from a dynamic resistance curve without a clearly defined peak in the same base material. However, Ku used only one base material in this study, and the welding conditions were changed only by changing the current; thus, there are limitations to using it in the field.
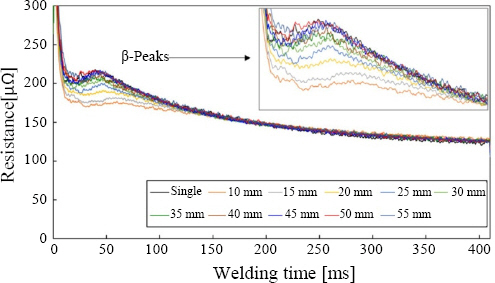
Research has also been conducted on models that can predict shunting effects as well as nugget size using dynamic resistivity curves. Yu4) proposed a reference- based adaptive resistance spot welding method to reduce the shunting effect by establishing an exponential model to predict the weld pitch as a function of dynamic resistance and a logistic growth model to predict the heat input compensation through the relationship of nugget diameter and heat input with weld pitch. Based on the dynamic resistance monitoring value, the model compensated for the heating loss due to the shunting effect by adjusting the welding time under constant current control until the heating compensation was achieved. Fig. 3 shows the kinetic resistance curves for different weld sebum under 7.5 kA welding current. For weld pitches of 10 to 40 mm, the ╬▓-peak, the peak point of the co-resistance, decreased significantly as the weld pitch decreased. In short-pitch resistance spot welding, a parallel electrical circuit was formed by the shunt weld, which reduced the resistance around the ╬▓-peak. Since the shunt effect decreases as the weld pitch increases, the dynamic resistance curve for weld pitches greater than 45 mm was almost identical to the curve for shunt welds, indicating that the shunt effect for weld pitches greater than 45 mm was minimal. After the ╬▓-peak occurred, the dynamic resistance curves gradually decreased and converged, which is because both contact resistance and bulk resistance decreased in the shunt weld after the ╬▓-peak occurred, minimizing the shunt effect. The experimental results showed that the resistance spot welding technique proposed by Yu simultaneously increased the nugget diameter and reduced the shunting effect in short pitch resistance spot welding compared with the conventional welding method.
Fig.┬Ā3
Dynamic resistance over time under a constant 7.5 kA welding current and for various weld pitches4)
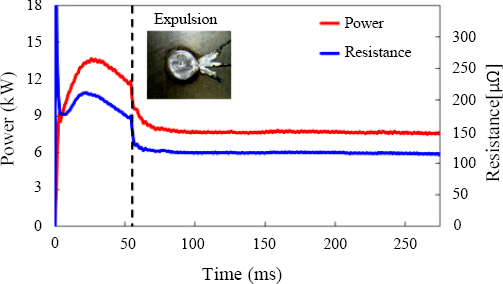
Similar to resistance spot welding monitoring through the analysis of dynamic resistance patterns, there is also a technique for monitoring welding quality through the analysis of welding power signals. The welding power signal is characterized by the fact that it is not affected by the force of the electrode compared to the resistance value. Hence, it is possible to monitor the process regardless of the influence of the pressurization force. Yu5) analyzed the characteristics of the welding power signal in the resistance spot welding process of DP980 MPa material to improve the weldability of high- strength steel plates, and developed a resistance spot welding quality prediction model using a logistic regression model. The variables were peak power, peak time, GI coating, electrode pressurization, and power drop, and the prediction accuracy of the multinomial logistic regression model was greater than 95%. Fig. 4 shows the welding power and resistance signals at the time of expulsion. At the moment of expulsion, the molten metal is ejected from the weld. Thus, the power and resistance drops can be clearly observed. Using these characteristics, the weld power curve can be used to monitor the welding quality. In addition, Yu6) proposed two welding methods to improve the weldability of high-strength steel plates. The first method is the reference welding process, which uses conventional constant current control welding to perform welding by referring to the welding power curve of suitable welding conditions. The second is a modified welding method, which is designed to suppress the occurrence of expulsion in the welding process, resulting in a more stable weld. The characteristics of the two proposed welding methods were analyzed by comparing them with commercial constant current control welding, and the advantages and effects of the two welding methods were reported through experiments in various welding environments.
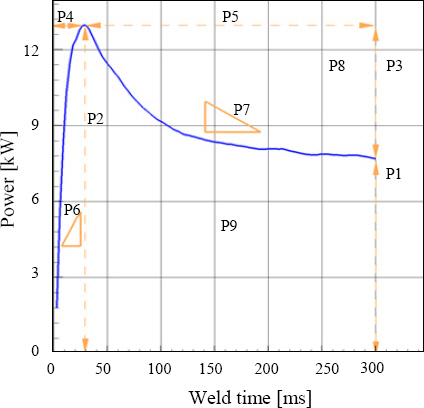
The aforementioned study by Yu was on the monitoring of the resistance spot welding process using homogeneous materials. Monitoring techniques for resistance spot welding of not only homogeneous but also dissimilar material combinations were researched. Kim7) used the results of homogeneous and dissimilar resistance spot welding to determine the welding quality. Power curves were extracted using welding current and resistance signals as independent variables, and the relationship between welding power and nugget diameter was demonstrated by correlation analysis. Furthermore, linear regression and artificial neural network models were built using the power data to predict the weld nugget diameter. Fig. 5 shows the welding power values as a function of welding time. As shown in Fig. 5, nine factors necessary for welding quality prediction were extracted from the welding power curve, and the nugget diameter prediction model using them showed that the prediction accuracy of the artificial neural network model was higher than that of the multiple regression model.
As shown in the aforementioned studies, the monitoring of copper resistance values or welding power during the welding process allowed for the extraction of features from the respective data, which could then be used to predict welding quality, such as nugget size or the occurrence of expulsion. It can also be seen that research continues on new techniques to improve the accuracy of predicting welding quality through monitoring.
2.2 Electrode Displacement Monitoring Technology
In the previous section, we discussed research on predicting the welding quality by monitoring the dynamic resistance value of the resistance spot welding process. In this section, we will describe a study that monitors the electrode displacement using an LVDT sensor for changes in the electrode and workpiece during the process. In the actual resistance spot welding process, the electrode displacement and workpiece vary depending on the heating conditions, but it ranges from tens of ╬╝m to hundreds of ╬╝m. Monitoring of this material and electrode displacement can be used to predict the quality of the weld.
Kim8) examined a monitoring technology that can judge the quality of the resistance spot welding zone in real time by using the expansion and contraction of the material during the heating and cooling process during the resistance spot welding process, which applies a reaction force to the welding electrode controlled by the appropriate pressurization force and causes a change in the encoder value. Since the displacement of the welding electrode during resistance spot welding varies depending on the amount of heat input, the quality of the resistance spot welding zone was evaluated by correlating the shear tensile strength and the servo displacement value after welding. Fig. 6 shows the electrode displacement value when resistance spot welding was performed using a medium-sized C gun. As shown in the figure, the electrode displacement starts as the nugget of the weld expands as it is formed, and after the welding process is over, the displacement value that changed due to the expansion of the nugget returns to its position as the nugget contracts.

Kim9) developed a model to predict the indentation depth of a spot weld by monitoring the electrode displacement signal using LVDT. Using the electrode displacement signal parameter information, the indentation depth prediction model was estimated using a multiple regression model. As shown in Fig. 7, three feature points A, B, and C were selected, and five parameters were selected based on the three selected feature points, and a model with a coefficient of determination of 94.72% was developed using a multiple regression model through the backward elimination method. In Fig. 7, feature point A is the maximum value of electrode displacement, feature point B is the end of current energization, and feature point C is the end of holding time.

Kim10) developed four models to predict the tensile shear strength, expulsion occurrence, and failure mode as well as the indentation depth based on the electrode displacement signal, material information, and dynamic resistance signal obtained through LVDT. The proposed models were validated by analysis of variance, and the prediction accuracy of the proposed models was higher than 93% except for the failure mode, which was 85%.
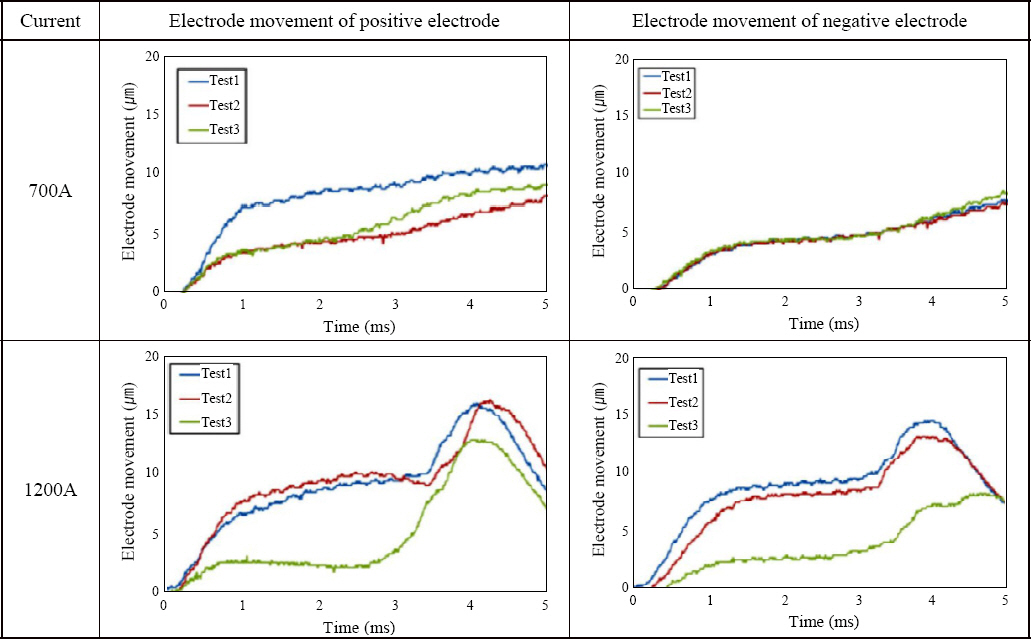
In addition to this general resistance spot welding, the monitoring of electrode movement has been used to predict the welding quality in micro-series resistance spot welding. Lin11) proposed an electrode movement monitoring system applicable to micro-series resistance spot welding using dual accelerometers. The expansion/ contraction movement of the electrode during micro-series spot welding using 304 stainless steel was monitored through the analysis of dual accelerometer signals and electrode movement signals. Fig. 8 shows a schematic diagram of the dual accelerometer monitoring system used in this study. Fig. 9 shows the electrode movement waveforms as a function of welding time measured by the dual accelerometers at different welding currents. The continuous heat generation during the entire welding process resulted in significant thermal expansion, which caused the electrode to separate. As the size of the molten nugget and the cross-sectional area through which the current flow increases, the material around the nugget softens and plastic deformation occurs, embedding the electrode into the specimen. The generation of more heat causes faster melting of the material, which is why the peak time shifts to the left as the welding current increases. Moreover, as shown in the figure, the amplitude of the anode movement is always larger than the cathode movement due to the Peltier effect, regardless of the welding current setting. In this way, the monitoring of electrode movement as a function of welding time using dual accelerometers can be used to monitor and predict the quality of the welding process.

Fig.┬Ā9
Electrode movements for various weld currents. (Thickness = 0.3 mm, electrode force = 30 N, weld time = 5 ms)11)
We have reviewed studies on quality monitoring of resistance spot welding through electrode displacement, and the range of electrode displacement measurements by LVDT sensors is in the tens of micrometers as shown in the studies. Therefore, the accuracy of quality prediction depends on the accuracy of the LVDT sensor. In the future, when more precise LVDT sensors are available, it will be possible to perform various monitoring and advanced research on the results of the resistance spot welding process.
2.3 Camera sensor-based welding quality monitoring technology
Advances in camera sensors are enabling a wide variety of process monitoring in many industrial and manufacturing applications, not just welding. There is a lot of research on process monitoring using camera sensors in other welding processes as well. For example, in the resistance spot welding process, camera sensors are used to acquire heat trace information of the weld and analyze it through mechanical learning to predict the quality of the weld.
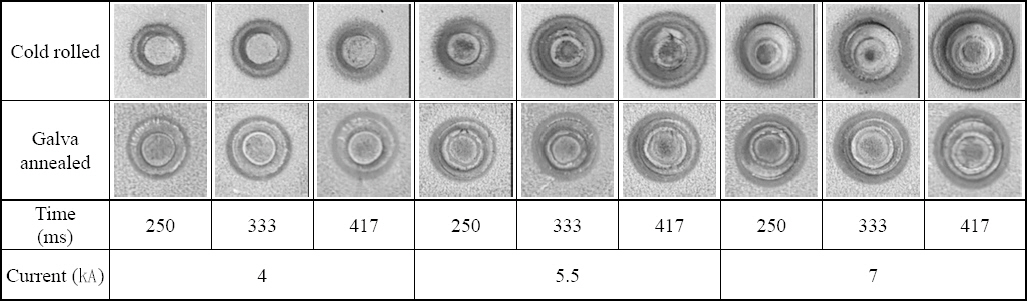
Choi12) monitored the resistance spot welding quality by using the heat trace image of the spot welding surface of uncoated CR and GA 980 MPa class ultra-high tensile steel plates acquired using a camera. Convolutional neural network (CNN) algorithm was used to predict the welding quality such as tensile shear strength, nugget diameter, weld fracture mode and expulsion occurrence. The error rate of the CNN algorithm for tensile shear strength and nugget diameter was 2.2% and 2.6%, and the prediction accuracy for failure mode and expulsion occurrence was reported to be 100%. Fig. 10 shows the transformation of weld images acquired through the camera sensor into data for training the CNN algorithm. The original color image captured by the camera was converted to a gray image and used as input data for image quality prediction. Each pixel data value of the converted gray image was normalized to a value between 0 and 1 with a minimum value of 0 and a maximum value of 1. Fig. 11 shows the heat trace images of the weld surface under different welding conditions. The higher the welding current and time, the larger the heat signature on the specimen surface. The expansion of the heat trace indicates an increase in shear tensile strength and nuggets. Moreover, the GA sheet with Zn coating showed a smaller heat trace than the CR sheet. These significant differences can be used to predict the quality of the weld by analyzing the images acquired by the camera sensor.

2.4 Deep learning-based resistance spot welding quality monitoring technology
Recently, deep learning technology has been developed and applied to the quality monitoring of various welding processes. Resistance spot welding quality monitoring is no exception. When we look at the recent trends in resistance spot welding quality monitoring using deep learning technology, we can categorize them as follows. The first is the application of image analysis technology to predict and monitor welding quality through input to a deep learning model. The second is welding quality monitoring technology using deep learning models based on artificial neural networks. For deep learning-based welding quality monitoring technology, data collection and preprocessing technology is an important element technology, and many studies are being conducted on it. There are several studies on this topic which are worth mentioning. For reference, the first mentioned research on monitoring technology through the application of image analysis technology was classified as welding quality monitoring technology using camera sensors in the previous section 2.3.
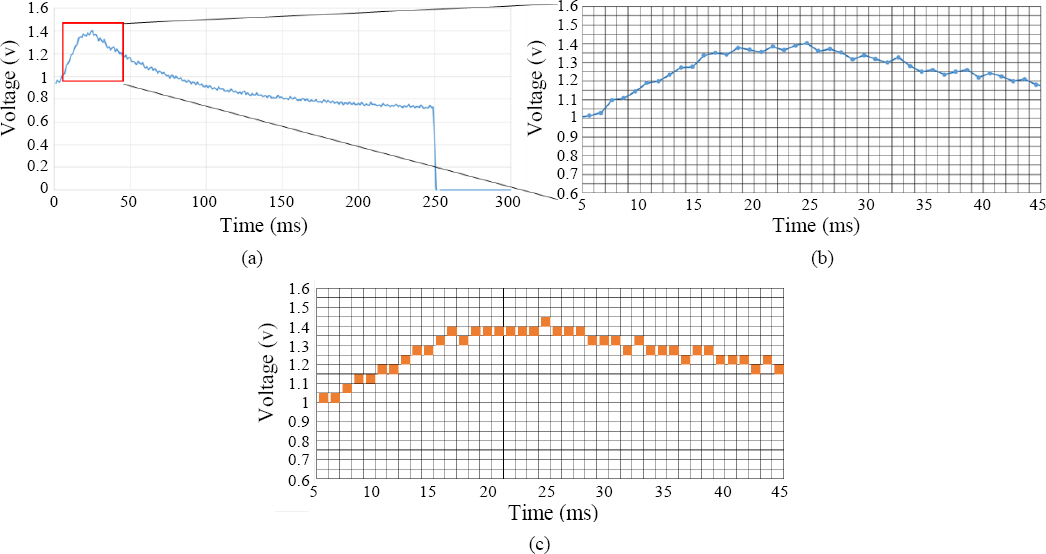
Hwang13) utilized an adaptive resonance theory (ART) artificial neural network technique to monitor current and voltage waveforms for a 780 MPa DP material to predict tensile shear strength, nugget size, and failure mode. Fig. 12 shows the process of converting the measured values of weld voltage into input data for the ART artificial neural network in this study. The input layer information of the ART network is a set of binary data consisting of 0s and 1s, and the input layer signal must be converted to binary data consisting of 0s and 1s. If the grid through which the welding voltage signal passes is represented by 1, and the grid through which the welding voltage signal does not pass is represented by 0, the final representation can be shown in Fig. 12(c). The converted information can be used as the input layer of the ART artificial neural network to predict the quality of the spot weld.
Fig.┬Ā12
Conversion process of input layer data for ART artificial neural networks in the welding voltage, (a) average welding voltage signal during 1 ms, (b) zoom-in of the average welding voltage signal, and (c) pattern matching result of zoom-in average welding voltage by ART artificial neural networks13)
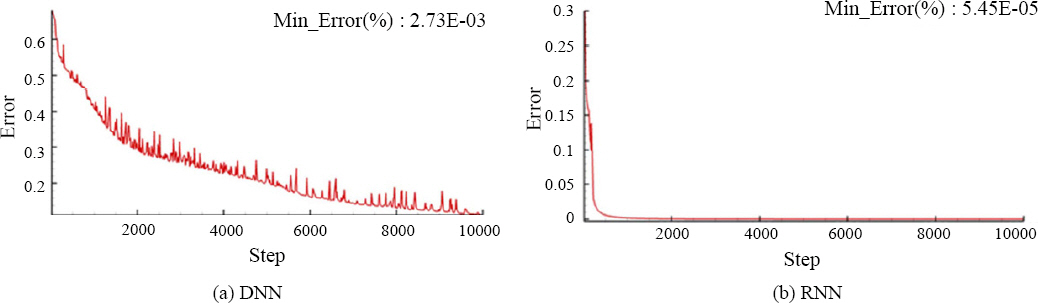
Kim14) reported on a monitoring technique to determine the defects of resistance spot welding zone using deep learning technology. In this study, a welding quality judgment model using deep neural network (DNN) and recurrent neural network (RNN) was proposed, and neural network analysis was performed using the same resistance value. Fig. 13 shows the DNN and RNN error graphs. As shown in the figure, RNN can recognize weld defects with higher accuracy than DNN.
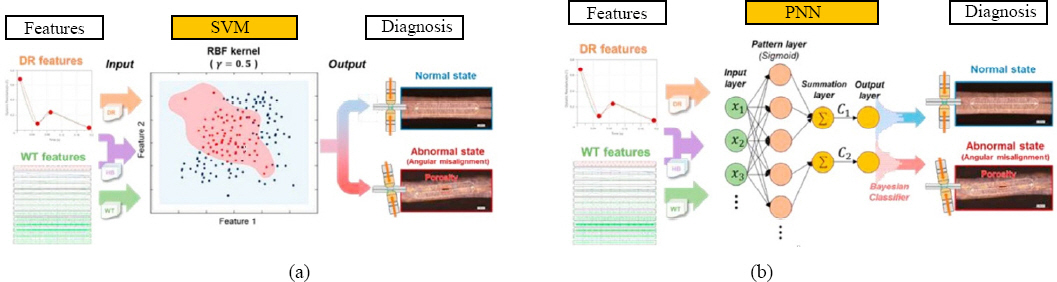
Lee15) investigated a real-time monitoring technique for angular misalignment of electrodes in a robotic resistance welding system. Two types of features, physics- based features by dynamic resistivity and data-based features by wavelet transform, were extracted and analyzed by statistical methods. Then, two machine learning algorithms, Support Vector Machine (SVM) and Probabilistic Neural Network (PNN), were applied to develop a resistance spot welding quality diagnosis model. Fig. 14 shows the schematic diagram of the angular misalignment diagnosis model using SVM and PNN. The results of the analysis using physics-based features by dynamic resistance, data-based features by wavelet transform, and hybrid features by combining these two features showed that the quality prediction using hybrid features was the best in terms of accuracy and robustness of the model.
As discussed, deep learning technology for welding quality monitoring is a technology that predicts and monitors welding quality by using various variables that occur in the welding process as input data. There are several directions for the development of monitoring technology using deep learning technology. The first is to reduce noise in the data collection process and improve data quality through the development of sensor technology to train deep learning models. Second, we need to develop technologies to collect and analyze data using various sensors in an integrated manner. Further- more, it is necessary to improve the performance of deep learning models and develop deep learning models that can be generalized through scaling, rather than models that only work effectively in specific welding conditions.
As described above, resistance spot welding quality monitoring technology monitors welding quality through the application of various sensing methods for welding process variables and results. Based on the review of various monitoring technologies listed above, the advantages, disadvantages, and field applicability of each monitoring technology are summarized in Table 1.
Table┬Ā1
Comparison of the advantages, disadvantages, and field applicability for various resistance spot welding monitoring technologies
3. Conclusion
This review article introduced the latest domestic developments in resistance spot welding quality monitoring technology. When research on resistance spot welding quality monitoring technology was surveyed, the most common research was on monitoring technology using dynamic resistance patterns using welding current and voltage measurements. Similarly, quality monitoring technology using welding power analysis is also being researched. Electrode displacement monitoring technology using LVDT sensors has also been studied for quality prediction of electrode displacement and weld mechanical properties and expulsion phenomena. Various types of resistance spot welding quality monitoring are being conducted, including monitoring technology through the analysis of images acquired by camera sensors, and quality prediction by deep learning technology using measured values such as dynamic resistance, electrode displacement, and image as input information. Rather than using only one monitoring technique to ensure the reliability of the weld, it is determined that the technology is developing in the form of quality monitoring through the collection of various process information and results through various sensors.
 PDF Links
 PubReader
 ePub Link
 Full text via DOI
 Download Citation
 Print
Print