1. Introduction
Technological advancements have enabled shipyards to automate many aspects of shipbuilding, including welding processes. In fact, large shipyards have achieved over 70% automation of welding processes, which has led to increased efficiency and reduced costs. Despite the high level of automation, there are still manual welding processes that cannot be replaced. Manual welding is especially important for critical components of the ship, such as the hull and structural supports, where the automated machines cannot be applied.
Due to the recent boom in the shipbuilding industry and the technological demands for high quality, the demand for high-skilled welders is increasing, but the supply of such welders is still insufficient. It is not only time-consuming but also difficult to train high-skilled welders, as the current labor market tends to avoid strenuous work. Therefore, there is a need for technological solutions to cope with the difficulties in training welders. To address this issue, research is being conducted on two fronts: 1) improving the education of novice welders, and 2) formalizing the tacit knowledge of high-skilled welders into a knowledge asset of welding technology. Matsuura
1) has proposed and implemented a new teaching method by implementing a technical information structure in consideration of the proficiency required for unskilled welders in order to convey the tacit knowledge of ŌĆśsenseŌĆÖ of high-quality welders. Asai
2) said that how to digitize and quantify the skills of high-capacity welders is an important point in fostering skilled workers and inheriting technology, and that the use of digital data is essential. Their goal is to create standard models of welding patterns that welding students can easily follow. This would enable unskilled welders to improve their welding skill in a shorter amount of time than they currently can.
Recently, machine learning has emerged as a powerful tool for improving the welding education system. By analyzing large volumes of welding process data, machine learning algorithms can uncover patterns and insights that are not immediately apparent to human observers. This technology has the potential to revolutionize the way welding-related knowledge is accumulated and utilized in training programs, leading to more effective instruction and better-trained welders.
Jung and Sim
3) used the association rule algorithm of R as well as regression analysis technique to analyze the structure of power consumption and wire consumption length for a large amount of pattern variables for high-skilled welderŌĆÖs welding pattern analysis. Gavidel et al.
4) compared and analyzed several machine learning algorithms, such as K-nearest neighbor (KNN), support vector machine (SVM), linear discriminant analysis, and quadratic discriminant analysis, for evaluating welding process performance in gas tungsten arc welding. Unfortunately, there is still a significant lack of research dedicated to unskilled welders, and the analysis of current technology remains limited. Therefore, it is imperative that we shift our attention towards the development of a digital assetization system for welding knowledge within the welding training process, utilizing the SECI model
5). The SECI model, conceptualized by Nonaka and Takeuchi, serves as a valuable framework for knowledge creation and sharing
5). It describes the process of how knowledge is generated and transferred in four main stages:
1) Socialization: Involves the sharing of tacit knowledge among individuals through communication and shared experiences.
2) Externalization: The tacit knowledge is converted into explicit knowledge by expressing it in words or other tangible forms for sharing.
3) Combination: Explicit knowledge is combined and organized within the organization to create new insights and knowledge.
4) Internalization: External knowledge shared within the organization is internalized and absorbed by individuals, becoming part of their personal knowledge and experiences.
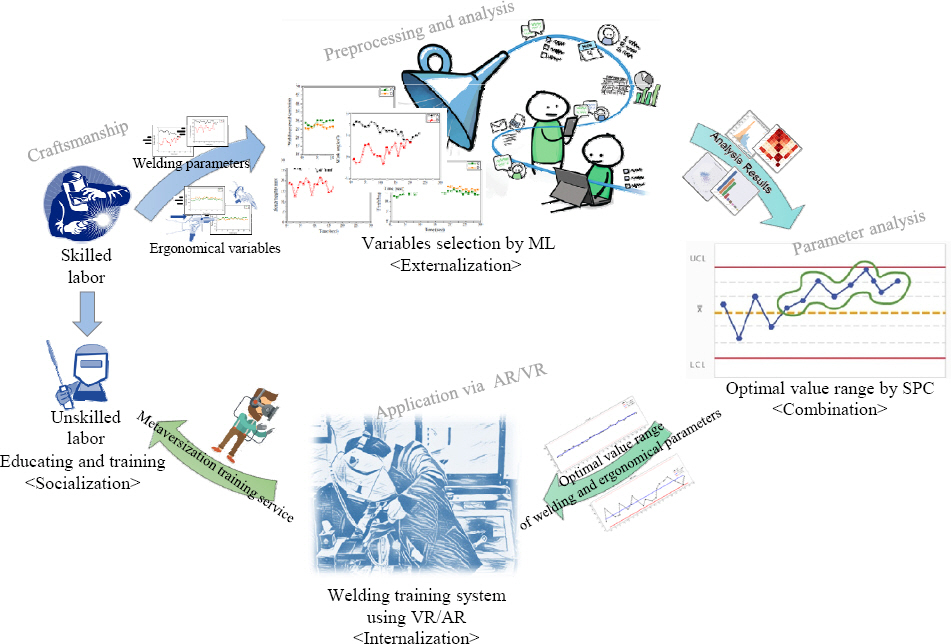
The SECI model helps understand the flow of knowledge within an organization and facilitates effective learning and knowledge sharing processes. Currently, the shipyard training center corresponds to the first socialization above, and the instructor is teaching the technology directly to the unskilled welder. As the second externalization stage, a preliminary study was conducted to extract significant differences in welding parameter data between experienced welders and unskilled welders
6,7). To guide welding training within the scope of welding data implemented by skilled welders, we introduced a strategy using machine learning based on the welding pattern of skilled welders
6) as shown
Fig. 1.
Fig.┬Ā1
Before moving on to the study of the combination stage, this paper proposes a practical solution for clustering-related machine learning, which evaluates data from more than 10 different welding parameters by dividing them into skilled and unskilled. Moreover, this paper introduces algorithms that can provide targeted guidance for skill improvement, enhancing the overall effectiveness of welding training programs. For this purpose, the data is collected from two groups: high- skilled welders and unskilled welders. To evaluate the performance of manual welders, clustering specific machine learning algorithms such as KNN and SVM are used, and their results are compared. These study findings suggest that welding education systems could be expanded to quickly improve the welding quality of unskilled welders.
2. Data Acquisition and Preprocessing
This chapter outlines the welding data parameters collected from welders and explains the necessary data preprocessing for analysis. In machine learning, a common technique for extracting valuable insights from numerical data involves its transformation into ranked categorical data. This process involves assigning a rank or category to each numerical value based on its relative magnitude. By doing so, we can interpret the data more easily by machine learning algorithms, which can identify patterns and make predictions based on the categories or ranks.
2.1 Data Acquisition
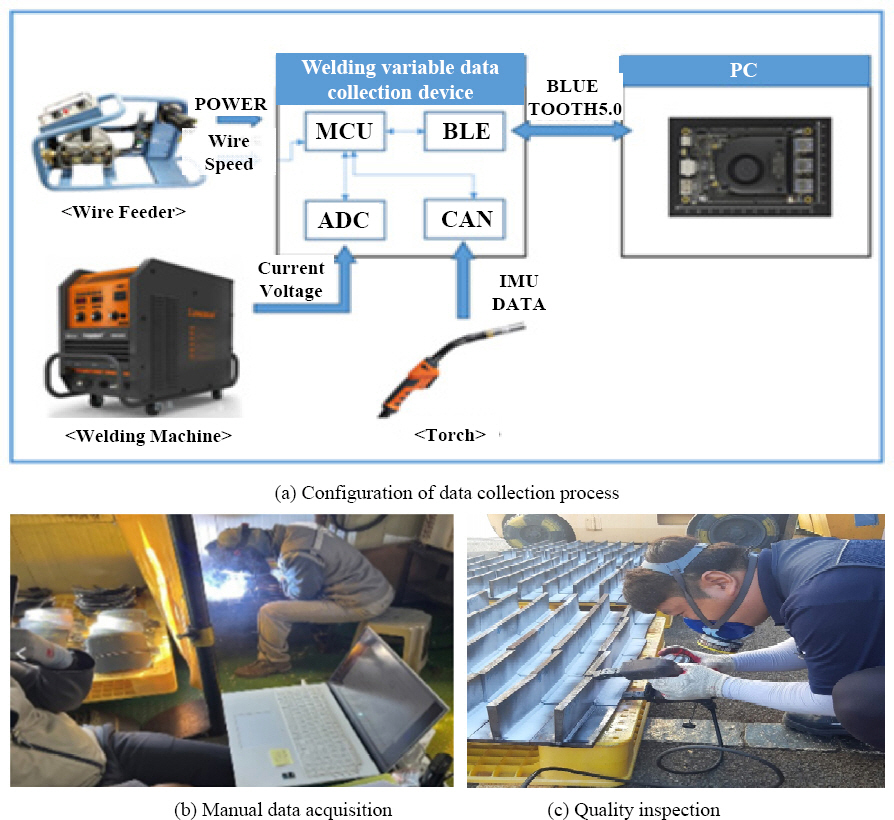
We describe the analysis of welding data parameters required for performance prediction techniques. A comprehensive dataset comprising 376 data points was compiled, encompassing 179 data points from high- skilled welders and 197 data points from unskilled welders. The data collection device was configured to collect data, as seen in
Fig. 2, through wired and wireless communication in a way that does not affect the welderŌĆÖs work safety and convenience.
Fig.┬Ā2
Manual welding data acquisition and quality inspection
Welding experiments were conducted targeting specimen thicknesses of 4 mm and 6 mm, as well as welding positions of 1G, 2G, and 3G. The experimental conditions are summarized in
Table 1.
The welding quality inspection was conducted using a magnetic particle method, with a pass rate of 261 and a fail rate of 115, representing an overall fail rate of approximately 30.59 %. The high-skilled welders group showed a 100 % pass rate, while the unskilled welders group showed a fail rate of approximately 58.38 %.
The collected welding parameters for the experiment consist of a total of 21 parameters including group, ID, current (ampere), voltage, wire speed, inertial measurement unit (IMU) sensor data, work angle, travel angle, contact tip to work distance (CTWD), and welding result, as shown in
Table 2. While previous research has focused on the four variables of welding speed, working angle, travel angle, and CTWD
7), we explore a broader range of variables to gain a more comprehensive understanding of the factors that influence training results.
Table┬Ā2
Experimental data overview
|
No |
Parameters |
Description |
Measurement unit |
|
1 |
Time |
Data collection time |
1/1,000 sec |
|
2 |
Ampere |
Ampere from welding machine |
A |
|
3 |
Voltage |
Voltage from welding machine |
V |
|
4 |
Wire speed |
Wire feeding speed |
Mm/s |
|
5 |
IMU |
Roll |
Rotation degree of welding torch in x-axis |
┬░ (degree) |
|
6 |
Pitch |
Rotation degree of welding torch in y-axis |
|
7 |
Yaw |
Rotation degree of welding torch in z-axis |
|
8 |
Acceleration X |
Acceleration speed of welding torch in the direction of x-axis |
|
|
9 |
Acceleration Y |
Acceleration speed of welding torch in the direction of y-axis |
╔Ī (gravitational acceleration) |
|
10 |
Acceleration Z |
Acceleration speed of welding torch in the direction of z-axis |
|
|
11 |
Angular velocity X |
Angular velocity of welding torch in the direction of x-axis |
┬░/s |
|
12 |
Angular velocity Y |
Angular velocity of welding torch in the direction of y-axis |
|
13 |
Angular velocity Z |
Angular velocity of welding torch in the direction of z-axis |
|
14 |
Magnetism X |
Geomagnetism of welding torch in the direction of x-axis |
|
|
15 |
Magnetism Y |
Geomagnetism of welding torch in the direction of y-axis |
┬ĄT (microtesla) |
|
16 |
Magnetism Z |
Geomagnetism of welding torch in the direction of z-axis |
|
|
17 |
Work Angle |
Angle between the weld axis and the electrode axis |
┬░ (degree) |
|
18 |
Travel Angle |
Angle between the electrode axis and a line perpendicular to the weld axis |
┬░ (degree) |
|
19 |
CTWD |
Contact tip to work distance |
mm |
|
20 |
Speed |
Speed at which the welding torch or gun is moved across the workpiece |
cm/min |
|
21 |
Quality |
Welding test quality |
Pass or Fail |
To prevent distortion due to data outliers, the ends of the welding specimens were excluded from the measurements
8). In addition to the key parameters traditionally considered in welding-related experiments, it is becoming increasingly apparent that additional parameters are required to derive a practical and effective welding behavior. This is why recent studies have explored the use of IMU sensors to collect and analyze a wider range of welding parameters. We collected 12 additional parameters through the IMU sensor, including torch rotation (roll, pitch, and yaw) for each axis, acceleration, angular velocity, and magnetism. With the aid of these parameters, a meticulous analysis of the implicit manual skills exhibited by high-skilled welders can be conducted, thus equipping unskilled welders with the ability to closely imitate the precise hand movements of their skilled counterparts.
2.2 Data Preprocessing
It was observed that there were missing values and extreme outliers in IMU sensor data, wire feed speed, and welding speed from the raw data of 376 collected datasets. These observations are likely due to momentary torch shaking caused by sensor malfunction and sensitivity of the speed measurement device. To mitigate the influence of extreme outliers, we employed a robust preprocessing approach. Firstly, the datasetŌĆÖs median was excluded from consideration. Subsequently, we utilized PythonŌĆÖs RobustScaler function, which normalizes the data based on the interquartile range spanning from the 1st to the 3rd quartiles, ensuring a robust standardization process. Standard normalization effectively minimizes the influence of extreme outliers and is particularly suitable for preprocessing data with frequent measurement errors that significantly affect trends.
After standard normalization, the standard deviation of each parameter was calculated through descriptive statistics to be used for performance prediction. Standard deviation is an indicator of the degree of variation in measured values, with lower standard deviation meaning lower variability in each indicator. This is more effective than measuring variations based on averages in assessing the welding skills of a welder
7). Finally, the numerical data for the standard deviation of each parameter was converted into categorical data with rankings. Well-designed categorical data can significantly increase the accuracy of classification by machine learning and artificial neural networks
9) and can show the differences between the high-skilled group and the unskilled group more clearly.
All numerical data, except group, ID, and quality results, were transformed into categorical data using the Likert 7-point scale, as shown in
Table 3. The Likert 7-point scale is known to provide higher accuracy than other Likert scales
10) and is appropriate for showing statistical information due to its higher number of data points. Rankings were designed based on the stability of each parameter value, with higher rankings indicating higher stability, meaning smaller standard deviation values. These rankings were then converted into seven categories: Excellent, Good, Above average, Average, Below average, Poor, and Very poor. The final form of the data, converted from numerical data to categorical data with rankings, is presented in
Table 4.
Table┬Ā3
Linkert 7-point scales for numerical data transformation
|
Range of StDev (S) |
Scale |
Likert scale |
|
S Ōēż 1.5 |
1 |
Excellent |
|
1.5 ’╝£ S Ōēż 2.5 |
2 |
Good |
|
2.5 ’╝£ S Ōēż 3.5 |
3 |
Above average |
|
3.5 ’╝£ S Ōēż 4.5 |
4 |
Average |
|
4.5 ’╝£ S Ōēż 5.5 |
5 |
Below average |
|
5.5 ’╝£ S Ōēż 6.5 |
6 |
Poor |
|
6.5 ’╝£ S |
7 |
Very poor |
Table┬Ā4
Form of categorical data for performance prediction of manual welding process
|
Group |
Ampere |
Voltage |
Wire speed |
Roll |
ŌĆ” |
Work angle |
Travel angle |
CTWD |
Quality |
|
Master |
Excellent |
Above average |
Excellent |
Excellent |
ŌĆ” |
Excellent |
Excellent |
Excellent |
Pass |
|
Master |
Good |
Average |
Excellent |
Excellent |
ŌĆ” |
Excellent |
Excellent |
Good |
Pass |
|
ŌĆ” |
ŌĆ” |
ŌĆ” |
ŌĆ” |
ŌĆ” |
ŌĆ” |
ŌĆ” |
ŌĆ” |
ŌĆ” |
ŌĆ” |
|
Trainee |
Above average |
Average |
Poor |
Excellent |
ŌĆ” |
Excellent |
Excellent |
Excellent |
Pass |
|
Trainee |
Above average |
Below average |
Average |
Good |
ŌĆ” |
Good |
Good |
Good |
Fail |
3. Data Analysis
We visualize and analyze the manually welded data by examining distribution, density, and correlation to explain how the differences between parameters determine the welding quality depending on the skill level of manual welding.
3.1 Analysis of data correlation
Data visualization and correlation analysis of collected manual welding parameters were performed using Python3 with NumPy, Pandas, and Seaborn modules.
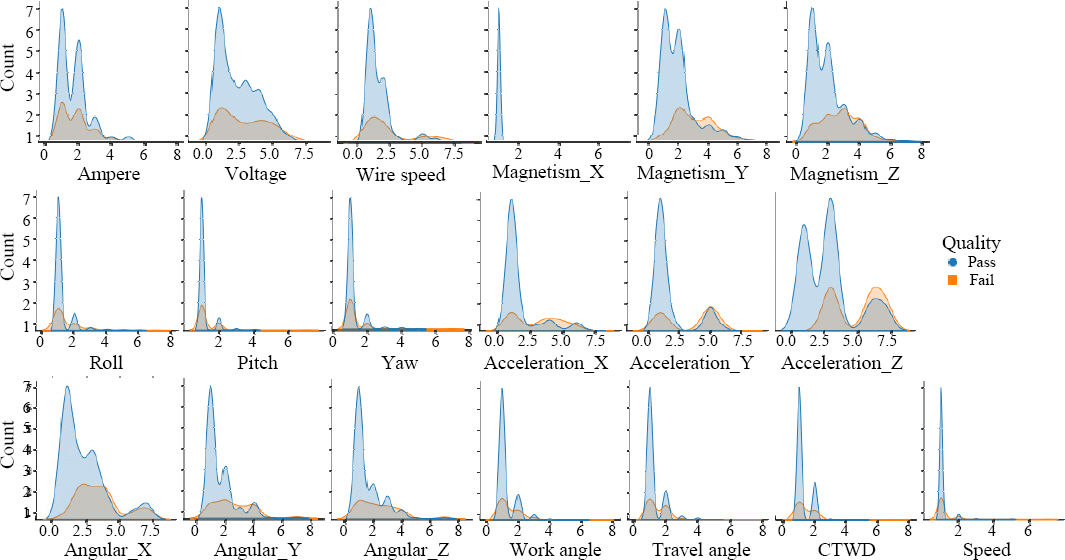
Fig. 3 shows a histogram-based density plot of welding quality results. The group that achieved a pass quality result exhibited a narrow range of variation and high density at specific points for parameters such as Magnetism X, Roll, Pitch, Yaw, Work angle, Travel angle, CTWD, and Speed. Additionally, this group demonstrated a consistent performance with minimal fluctuations in these parameters. In contrast, the group that did not pass quality standards had a wider range of variation for the parameters Ampere, Voltage, Wire speed, and Angular velocity X, Y, Z, indicating that they had difficulty maintaining consistent performance in these categories.
Fig.┬Ā3
Histogram-based density plot of welding parameters
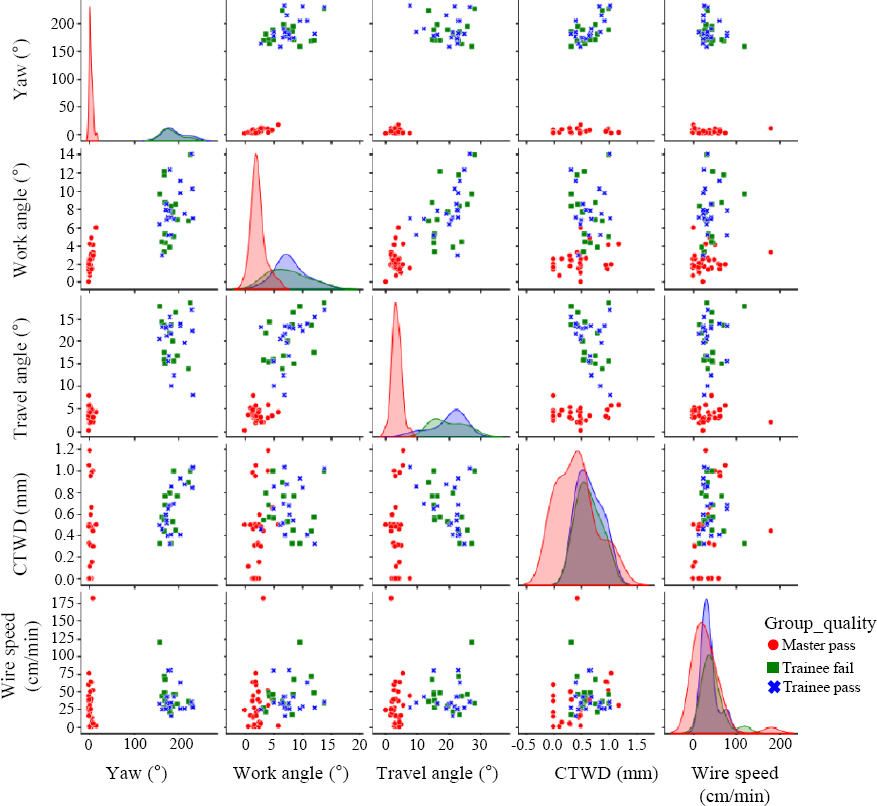
The scatterplot can confirm the tendency and trend between each independent variable. As it can be seen from the scatterplot graph of
Fig. 4, it can be seen that the distribution of Yaw, Work angle, and Travel angle is widely spread in the group that failed the quality test among trainees. In the group that passed the quality test, it can be seen that the fluctuation range of the Yaw, Work angle, and Travel angle is small for skilled welders. In addition, parameters that visually show the difference between the success and failure of welding results in the trainee group cannot be identified, but there is a difference in the distribution of work angle and travel angle.
Fig.┬Ā4
Scatter plot by group quality
3.2 Data correlation between three population groups
Density graphs of the quality results for the high-skilled welder and welder trainee groups are shown in
Fig. 5. As no quality issues were identified in the high-skilled welder group, we have categorized the results into three distinct groups: high-skilled welder-pass, welder trainee-pass, and welder trainee-fail.
Fig.┬Ā5
Histogram-based density plot of welding parameters for three groups
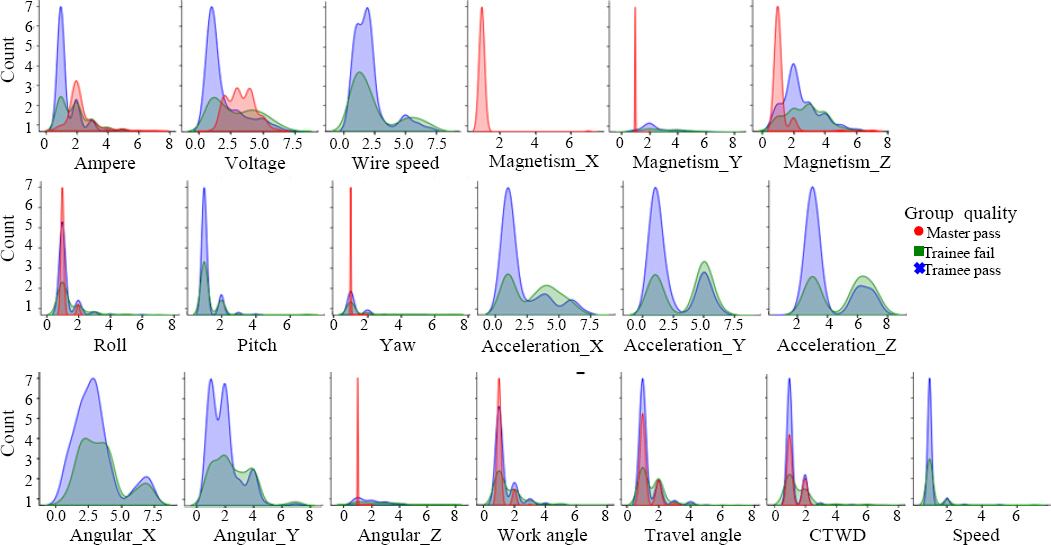
Fig. 5 reveals that the skilled welder-pass group demonstrated a concentrated distribution and narrow range of variation for Magnetism X, Y, Z, Roll, Pitch, Yaw, Angular velocity Z, Work angle, Travel angle, CTWD, and Speed. These parameters display a high density at specific points, suggesting that skilled welders maintain consistent and precise control over these variables to achieve high-quality welding outcomes.
Within the welder trainee-pass group, we observed that certain variables such as Ampere, Voltage, Wire speed, Roll, Pitch, Acceleration X, Y, Z, Work angle, Travel angle, CTWD, and Speed also exhibited concentrated levels of variability. Interestingly, we noted that the high-skilled welder-pass and welder trainee-pass groups shared similar narrow ranges of variation in Roll, Work angle, Travel angle, CTWD, and Speed.
The aforementioned observations highlight the variability in welding parameters between high-skilled welders and trainee welders and suggest that different factors may influence welding quality depending on the welderŌĆÖs skill level. For instance, experienced welders may have established preferred values of Ampere and Voltage and may achieve high-quality welding results by precisely controlling and adjusting other parameters, such as Magnetism and Angular velocities. The high data density of welding parameters in the high-skilled welder-pass group further suggests that minimizing unnecessary movements, such as weaving and rotation of the welding torch, may also contribute to achieving high-quality welding outcomes.
Furthermore, our analysis indicates that maintaining optimal values of Ampere, Voltage, Wire speed, CTWD, and Speed, which have been extensively researched, is critical to achieving high-quality welding outcomes for the welder trainee-pass group. We also observed that most trainee welders in this group minimize unnecessary movements of the welding torch, including Roll, Pitch, and Angular velocity parameters, to improve the welding quality level. Ultimately, our findings suggest that achieving consistent and precise control over welding parameters is critical to achieving high-quality welding outcomes, regardless of the welderŌĆÖs skill level.
4. Performance Evaluation by Classification
Two classification algorithms in the field of machine learning were compared and analyzed to evaluate the performance of manual welders. General logistic regression analysis was also performed and used as an indicator of comparative advantage and performance between machine learning algorithms to be compared. The main goal of our study was to compare the performance of these algorithms and identify the most effective approach for analyzing the data. By conducting a rigorous analysis, we aimed to gain insights into the factors that contribute to the quality of manual welding. Our study is expected to provide valuable information for both researchers and practitioners in the field of welding and contribute to the development of more effective and efficient welding techniques.
4.1 Evaluation by logistic regression
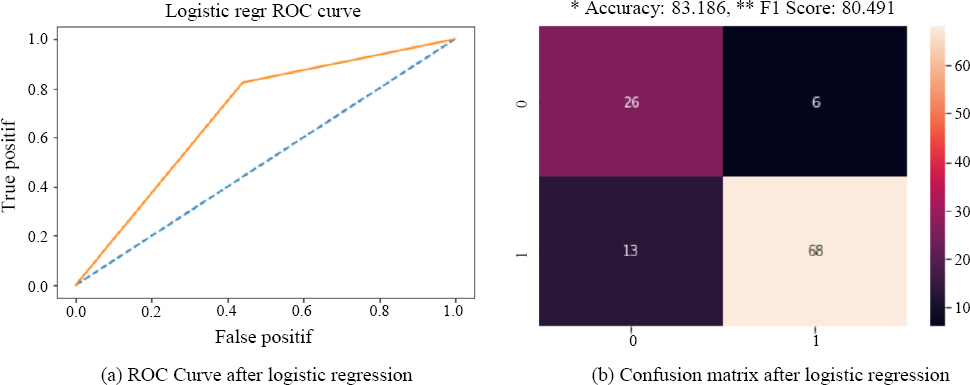
Logistic regression is a widely used statistical technique for predictive analysis, especially when the dependent variable is binary. This method quantifies the relationship between a binary dependent variable and one or more independent variables, which can be numeric, nominal, or ordinal, using a logistic regression function. In essence, logistic regression analysis is a type of multivariate regression that investigates the relationship between a single dependent variable and multiple independent variables. In this study, we employed logistic regression to analyze the manual welding data, and the results are presented in
Fig. 6. The ROC curve and confusion matrix depicted in the figure demonstrate that logistic regression achieved an accuracy of 83.186 and an F1 Score of 80.491, respectively.
Fig.┬Ā6
Experiment result of logistic regression
4.2 Evaluation by K-nearest neighbors algorithm
The K-nearest neighbors (KNN) algorithm is a widely used non-parametric classification technique due to its simplicity and high accuracy for numerical-based classification tasks
11). KNN classifies data points by grouping them into the same class as the majority of their K-nearest neighbors based on a probability density estimation method. It is important to select an appropriate K value to avoid issues such as overfitting or underfitting.
In this study, we implemented KNN using Python3 and classified the welding results into pass/fail based on a classification criterion. Hyper-parameter tuning was conducted to optimize the KNN algorithm. We split the dataset into training and validation sets in a 7:3 ratio, and the algorithmŌĆÖs accuracy was evaluated by varying the distance metric as a parameter adjustment for KNN. We considered three distance measurement parameters, namely Euclidean, Manhattan, and Chebyshev, to determine the K values that yielded the highest accuracy for the validation dataset within the range of 1 to 20. Euclidean measures the minimum distance between two points without considering the direction to measure similarity, while Manhattan measures the straight-line distance between coordinates to measure similarity. Chebyshev is used in limited cases where general similarity measurement methods such as Euclidean or Manhattan cannot be applied.
Table 5 presents the accuracy of the KNN algorithm with different values of K and distance metrics after hyper-parameter tuning. The results indicate that the accuracy of the algorithm is not significantly influenced by the choice of K or distance metric. The Chebyshev distance metric had a slightly lower computation time compared to the Euclidean and Manhattan metrics.
Table┬Ā5
Accuracy variance of KNN algorithm with hyper-parameter tuning
|
No. |
Metric |
Number of neighbors |
Estimated accuracy |
Calculation time [sec] |
|
1 |
Euclidean |
5 |
0.7965 |
0.0299 |
|
2 |
Euclidean |
6 |
0.7965 |
0.0195 |
|
3 |
Manhattan |
5 |
0.7965 |
0.0169 |
|
4 |
Manhattan |
6 |
0.7965 |
0.0196 |
|
5 |
Chebyshev |
5 |
0.7965 |
0.0194 |
|
6 |
Chebyshev |
6 |
0.7965 |
0.0101 |
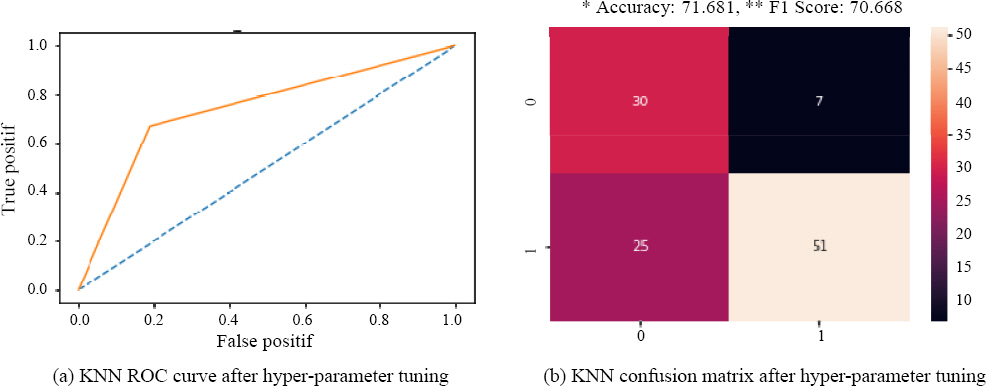
Fig. 7 illustrates the performance of the KNN algorithm with hyper-parameter tuning, displaying the receiver operating characteristic (ROC) curve and the confusion matrix. The ROC curve displays the sensitivity and specificity of the algorithm, with sensitivity on the y-axis and specificity on the x-axis. The closer the curve is to the upper left corner, the more accurate the classification is. The confusion matrix shows the accuracy of actual versus predicted classification, with an overall accuracy of 71.681 and an F1 score of 70.668. The difference between the F1 score and the algorithm accuracy may be due to the imbalanced class distribution with a ratio of approximately 3:1 between pass and fail data. Based on the F1 score value, the estimated actual accuracy of the KNN algorithm is around 70.668.
Fig.┬Ā7
Experiment result of KNN algorithm with hyper-parameter tuning
4.3 Evaluation by support vector machine
Support Vector Machine (SVM) is a widely used machine learning algorithm that can be used for binary classification problems or to create a non-probabilistic binary linear classification model for data with two categories
12). To increase the accuracy of SVM, different kernels can be applied, such as linear, polynomial, or Gaussian radial basis function.
We conducted an experiment to compare the performance of SVM using different kernels.
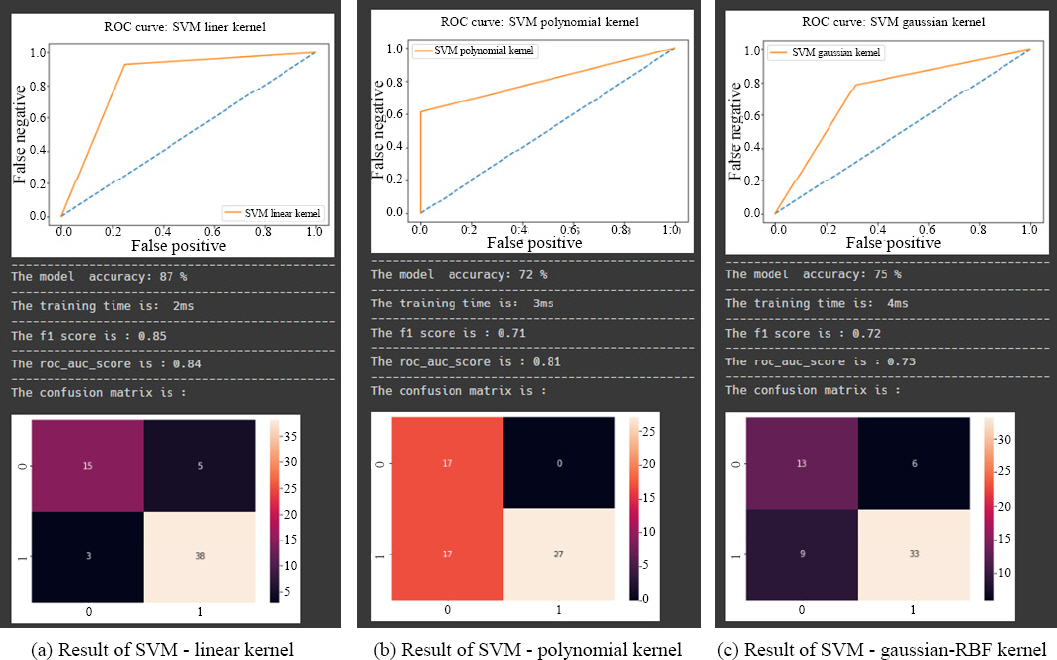
Fig. 8 shows the results of our experiment, including the accuracy, F1 score, and ROC curve values of SVM using each kernel. Our results show that the SVM model with a linear kernel achieved the highest accuracy of 87 % among the three kernels.
Fig. 8b) shows that the SVM model with a polynomial kernel had the lowest accuracy of 72 %. Lastly,
Fig. 8c) shows that the SVM model with a Gaussian-Radial Basis Function kernel had an accuracy of 75 %. Overall, our comparison of the three kernels suggests that the linear kernel performed the best on our dataset. However, it is important to note that the choice of kernel should be based on the specific characteristics of the dataset and the problem at hand.
Fig.┬Ā8
Experiment results of SVM algorithm with linear, polynomial, and gaussian-RBF kernels
Our analysis revealed that high-skilled welders and unskilled welders who passed the quality test were able to adjust parameters such as Pitch and Yaw effectively, while those who failed had difficulty adjusting parameters such as CTWD and Travel angle. These findings suggest that proper adjustment of these parameters is crucial in achieving high-quality welding results. Furthermore, our analysis indicated that other parameters, such as Angular velocity X, Acceleration, and Magnetism, require further detailed analysis. These parameters which are corresponding to welding torchŌĆÖs method of manipulation may have a significant impact on welding quality, but their contributions may be more complex and require further investigation.
The contribution analysis of each parameter by using the SVM, which showed the highest accuracy, is presented in
Table 6.
Table┬Ā6
Classification of parameters contributing to welding quality
|
Classification |
Parameters |
|
Parameters related to pass |
Angular velocity X, Magnetism Z, Pitch, Yaw |
|
Parameters related to fail |
CTWD, Angular velocity Y, Travel angle, Acceleration Y, Acceleration Z |
4.4 Comparison results
The results of the comparative analysis of machine learning algorithms as well as the regression analysis for performance evaluation of manual welders are shown in
Table 7 and
Fig. 9. The general logistic regression analysis was used as a metric for comparing the superiority and performance of each algorithm. As shown in
Table 7, the SVM algorithm demonstrates an accuracy of 87%, which is approximately 4% higher than logistic regression analysis and approximately 15% higher than the KNN algorithm. Additionally, in terms of F1 score, SVM outperforms logistic regression analysis by 5 points and KNN by 14 points.
Table┬Ā7
Comparison of three evaluation algorithms
|
Metric |
Algorithms |
|
Logistic regression |
KNN |
SVM |
|
F1 score |
80 |
71 |
85 |
|
Accuracy |
83 |
72 |
87 |
|
Confusion matrix |
[26ŌĆēŌĆē613ŌĆēŌĆē68]
|
[30ŌĆēŌĆē725ŌĆēŌĆē51]
|
[15ŌĆēŌĆē53ŌĆēŌĆēŌĆē38]
|
|
ROC score |
83 |
74 |
84 |
Fig.┬Ā9
Comparison of ROC curves of three evaluation algorithms
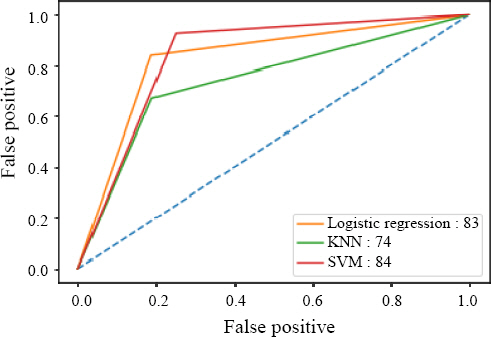
Moreover, in the analysis of the ROC curve, there is a negligible difference between SVM with a linear kernel and logistic regression analysis. These findings suggest that the data collected from high-skilled welders and unskilled welders exhibit a certain degree of linearity between the welding quality inspection results and welding parameters.
Therefore, through these results, we were able to confirm two things. Firstly, we observed linearity between the welding variables and welding quality inspection results through the collection and preprocessing of data from manual welders for machine learning training. Confirming linearity implies that the collected welding variables and welding results were well aligned through data preprocessing, suggesting that machine learning is likely to perform well in capturing this relationship. Secondly, among the compared algorithms, SVM with a linear kernel was determined to be the most efficient.
5. Conclusions
The field of welding is experiencing a surge in the application of cutting-edge technologies like artificial intelligence and big data analysis. Researchers are increasingly using these tools to predict welding quality by analyzing welding variables, leading to the advancement of welding automation. Despite this progress, manual welding remains a significant part of shipyard work, and the shortage of skilled welders continues to be a challenge. To address this ongoing issue, it is crucial to delve deeper into the implicit knowledge possessed by skilled welders. This can be achieved by investigating the correlation between quality and a broader range of variables and data beyond those traditionally analyzed in previous studies.
In this paper, we attempted to asset and analyze the tacit knowledge of high-skilled welders in the second stage according to the SECI model and use it for the manual welding education system and technology transfer strategy of welding trainees. We undertook a comprehensive comparative analysis of classification algorithms with the aim of assessing welding quality based on manual welding parameters, specifically focusing on torch movement parameters like the torch weaving technique. The outcomes of this analysis can be summarized as follows:
1) Effective Preprocessing with the Likert Scale: We initiated our study by investigating the suitability of various preprocessing techniques. Notably, we confirmed the effectiveness of employing a 7-point Likert scale during the preprocessing stage. This approach provided a linear framework that successfully aligned the range setting with welding variables. This alignment was instrumental in training our machine learning model with the manual welding data we collected, ensuring a meaningful connection between these variables and welding quality.
2) Insights from Data Visualization Analysis: Our data visualization analysis yielded insightful observations regarding the welding process. We found that the group that passed the welding quality inspection exhibited a remarkable degree of consistency in their torch movement parameters throughout the welding process. This consistency extended to crucial parameters such as Roll, Yaw, and CTWD. This finding underscores the pivotal role played by stability and uniformity in these welding process parameters when striving for high- quality welding outcomes.
3) Optimal Algorithm Selection: As part of our investigation, we compared various machine learning algorithms for their efficacy in evaluating the performance of welding trainees. Remarkably, the SVM with a linear kernel emerged as the clear winner, achieving a remarkable accuracy rate of 87%. This finding firmly establishes SVM with a linear kernel as the most suitable choice for assessing the performance of welding trainees based on our dataset.
The study findings revealed that manual welding data associated with high-quality welding is strongly correlated with variables such as roll, yaw, and CTWD of the welding torch manipulation. Moreover, it was discovered that the tacit knowledge of high-skilled welders resides in their hand skills for welding torch manipulation, and it is possible to acquire this knowledge by analyzing hand skill-related data. Therefore, incorporating visual or other forms of conveying the tacit knowledge of high-skilled welders during welding education can significantly reduce the amount of time it takes for trainee welders to attain the same level of proficiency.
Based on the results of this study, we will induce training of unskilled people to the range of optimal welding variables corresponding to the three-stage combination of the SECI model. In other words, research will continue on regression analysis algorithms that can induce weaving motion variables that affect welding quality, CTWD, and progress angle to the optimal range.
Acknowledgement
This work was supported by the Industrial Technology Innovation Program (20016155, Development of human factor-based knowledge assessment system for manual welding technology) funded by the Ministry of Trade, Industry & Energy of Korea and Korea Evaluation Institute of Industrial Technology.
References
3. S. H. Jung and C. B. Sim, A Study on a Working Pattern Analysis Prototype using Correlation Analysis and Linear Regression Analysis in Welding Big Data Environment,
J . Korea. Inst. Elect. Comm. Sci. 9(10) (2014) 1071ŌĆō1078.
https://doi.org/10.13067/JKIECS.2014.9.10.1071
[CROSSREF] 4. S. Z. Gavidel, S. Lu, and J. L. Rickli1, Performance analysis and comparison of machine learning algorithms for predicting nugget width of resistance spot welding joints,
Int. J. Adv. Manuf. Technol. 105(9) (2019) 3779ŌĆō3796.
https://doi.org/10.1007/s00170-019-03821-z
[CROSSREF] 5. I. Nonaka and H. Takeuchi. The Knowledge-Creating Company:How Japanese Companies Create the Dynamics of Innovation, 1st Edition. Oxford University Press. New York, USA: (1995)
6. C. S. Song and J. H. Nam, A Study on the Derivation Method for Optimal Variable Range of Highly Skilled Welder's Manual FCAW Using Machine Learning, Proceedings of the IWJC-Korea. (2022) 171ŌĆō172.
8. J. Y. Park and S. H. Song, Study on the Evaluation of Welding Soundness Based on Arc Stability and Bead Quality using the Statistical Analysis of Arc Power and Arc Dynamic Resistance,
J. Weld. Join. 37(6) (2019) 599ŌĆō604.
https://doi.org/10.5781/JWJ.2019.37.6.10
[CROSSREF] 9. E. Fitkov-Norris, S. Vahid, and C. Hand, Evaluating the Impact of Categorical Data Encoding and Scaling on Neural Network Classification Performance:The Case of Repeat Consumption of Identical Cultural Goods,
Engineering Applications of Neural Networks:13th International Conference, EANN 2012, London, UK, September 20-23, 2012. Proceedings 13. Springer Berlin Heidelberg(2012) 343ŌĆō352.
https://doi.org/10.1007/978-3-642-32909-8_35
[CROSSREF] 12. S. Suthaharan. In:Machine Learning Models and Algorithms for Big Data Classification, Support Vector Machine. Integrated Series in Information Systems. 36 Springer; Boston, Massachusetts, USA: (2016), p. 207ŌĆō235


 PDF Links
 PubReader
 ePub Link
 Full text via DOI
 Download Citation
 Print
Print


